Use SharePoint - Get a Gift
Microsoft is conducting a survey for people who use SharePoint daily (I am guessing each week day is enough to count for this). This survey can be done remotely which means that in SA we can take part (unless there is some other rule which prevents us) and in exchange for participation we get a Microsoft hardware or software title.
If you are interested please email [email protected] and insert SharePoint into the subject line.
Thanks to Mark Miller for the heads up!
Scott Hanselman - Last night at Microsoft
Being on the southern tip of the world and add the slowest bandwidth anywhere (confirmed by Scott himself) we seldom get the greats like Scott Hanselman out to talk to us, let alone for free, and when he is on holiday… but that is what the S.A. Developer community got last night and what a night it was. He spoke last night on MVC and I made some notes I thought I would share.
The first concept is that
- ASP.NET > Web Forms
- ASP.NET > MVC
It’s an interesting way of thinking that ASP.NET is not Web Forms, since it is normally that we use those two interchangeable. ASP.NET is a framework for building web applications, if we use web forms on that framework is a choice not a requirement. Web forms in itself is a lie, it tries to make us believe that the web is stateful… so that we get the RAD/VB6 experience for development. The problem is that like the Matrix, the lie constrains us. MVC is the anti-RAD in a way, it opens up a lot more to the developer than Web Forms traditionally does. Knowing there is a lie, and knowing the truth can hurt you (the same way Neo knew there was no gravity, yet fell) and so MVC can hurt you. MVC is NOT a replacement for Web Forms, it is another way to solve a set of problems and some problems are better solved in web forms, and others in MVC (or ASP.NET Dynamic Data).
MVC is made up of models, viewers and controls and all of these are changeable. So the viewers uses web forms to render the HTML, but there are other options. One of those is NHaml which is a very different way to create HTML (can read about it here) and I thought that looked very interesting. Viewers should contain no logic, they should focus on rendering HTML only. What is very nice is that for the rendering side JQuery is bundled directly into MVC! It is also important to note that ascx files (ASP.NET controls) are not a
Separate from the viewers is the controls which uses the ASP.NET Routing feature of 3.5 SP 1 heavily. It is very elegant in it’s implementation and shows a forward thinking of convention over configuration. In other words it if you type in a URL like http://test/account/view, it will first check in the viewers\account folder for a view.aspx or ascx file and then in the viewers\shared folder for a view.aspx or ascx file. No config to say that this URL maps to this file. Controllers should contain the bulk of the logic but should not have any web concepts (i.e. don’t use the Request object). Obviously you could, but this breaks the important separation in the MVC design. What is nice, is that because the design of MVC is to help enforce separation, unit testing is amazingly simple and if you have the full versions of Visual Studio then it even builds unit tests for you! So while it may be very easy to put some code in a controller to check if a user is authenticated, you need to decide what level of tolerance for code smell you can handle.
Separate still from both of those is the models. Which is your data model for example LINQ to SQL. The purest form of MVC is you have your data model and then a model to talk to controllers so there is a separation in the models and everything is clean. How much benefit that has in real world is unfortunately not that much and because you have the power (you took the red pill) you can share the model from the models to the controllers.
After that Scott showed his latest project, called NerdDinner. Which is based on MVC and will be an open source solution through CodePlex one day. He showed a lot of the code and highlighted the good bits and the bad bits. This really highlighted what he was talking about and some of the problems you need to solve when working with MVC. After that was Q&A with Pizza.
Defiantly one of the best talks I have attended in a long time. He is on his way to Cape Town (taking a day out of his holiday to fly specially to CT) so if you are in CT, you must go and see him! Details can be found on S.A. Developer!
SharePoint Survey Permissions: Part 2 - Allow anonymous users to vote on surveys
Part 1, which covers permissions to allow users to vote but not edit the website, can be found here
For the second post I thought I would share the most confusing issue I have personally with SharePoint survey permissions: namely on web site where anonymous users will hit it how do you let them vote? Since they are not members of the site you need to do a few extra steps to get it to work. Before I continue I recommend you read the first post since I will refer back to some parts of it.
The first thing is if you go to the permissions you need to give anonymous users permission, but there is no anonymous user option like we had with the domain group NT AUTHORITY\AUTHENTICATED USERS previously. However if you have configured anonymous access correctly you will find a menu option under settings which allow you to configure Anonymous Access.
You may find that it doesn’t work straight away, as in my case, because everything is set to read-only. So you can’t give the anonymous users permissions :(
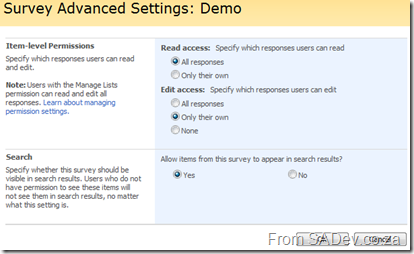
To solve this, you need to go to the advanced settings for your survey and set Read Access to All Responses, and click OK. Now don’t worry that you may be sharing information, you will turn this off again in a moment.
Now if you go back to the anonymous access settings section of the permissions those options has they are no longer read-only! You can now set up anonymous access to your survey and click OK,
Now, if you want to, you can go back to the advanced settings page and set the Read Access to Only their own. Note: The anonymous settings you set are not lost, they are just set to read-only and your survey is available to anonymous users.
SharePoint Survey Permissions Part: 1 - Respond to a survey but do not edit site content
Part 2, which covers permissions for anonymous users can be found here
Survey’s are a nice feature of SharePoint, however their security is not the easiest to understand. I thought it was just me which didn’t take to it straight away, but seeing Veronique's post on Information Worker made me think it is not just me. So for this post I will answer her question which I am summarizing as: How do you enable a user to respond to a survey but NOT edit the site (the survey sits in) content?
First off we need a survey:
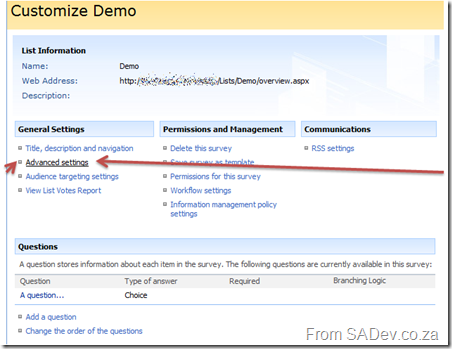
On the settings you need to click the permissions for the survey:
On the list permission settings click Actions and then Edit Permissions. At which point you will be asked to confirm you want to create unique permissions for the survey, in short it will not inherit from it’s parent security permissions in the future.

Actions –> Edit Permissions on the survey permissions.
For my example survey, I am assuming you want to let all users who logged into the site to complete the survey. So for that you need to find the NT AUTHORITY\AUTHENTICATED USERS domain group. Now click on it and make sure you give them Contribute and click OK. Now get back to the survey settings page.
Now click on advanced settings on the settings page.
The advanced settings page allows you to configure who can see what responses and what they can edit. Note: Edit here means changing their votes after they submit, not editing the survey or web site. The fact they have contribute means they can add (submit) votes.
Once you have done that your survey should be able to be completed by the users, but because we created unique permissions for the list/survey they won’t be able to edit the site which contains the survey.
Three tweaks and a tip for getting WCF to work with Silverlight
If you create a standard WCF service it does not work with Silverlight, it needs a few tweaks to get it to work. First is that Silverlight only supports connecting to a basicHTTP service and not a wsHTTP service, so you need to enable a second service or change your primary to basicHTTP, you can find out the reasons why by reading: Accessing SOAP Services
Second you need to attribute your class with: [AspNetCompatibilityRequirements(RequirementsMode = AspNetCompatibilityRequirementsMode.Allowed)]. For example:
1: namespace SilverlightApplication1Web
2: {
3: [ServiceContract(Namespace = "")]
4: [AspNetCompatibilityRequirements(RequirementsMode = AspNetCompatibilityRequirementsMode.Allowed)]
5: public class CustomerService
6: {
7: [OperationContract]
8: public int CountUsers()
9: {
10: return 2;
11: }
The third tweak is the biggest: Normally your WCF service and Silverlight application do not sit in the web application (either in Visual Studio or on the server) and due to the security put in place to prevent cross site attacks your service calls will fail. Obviously creating a web application with everything in is a solution, but if you haven’t you must add a security file to the WCF service web application. There are two files you can create in the root of your website, the first one is a crossdomain.xml. Crossdomain.xml is a format created by Macromedia. I do not recommend this one for Silverlight scenarios as Silverlight only supports a subset of the functionality but if you need to deal with Flash based clients then this is the route you must follow. Your other option is the Microsoft way, which is to create a file called clientaccesspolicy.xml. A clientaccesspolicy.xml to allow all methods, from all clients, to all URLS looks like this:
<?xml version="1.0" encoding="utf-8"?>
<access-policy>
<cross-domain-access>
<policy>
<allow-from http-request-headers="*">
<domain uri="*"/>
</allow-from>
<grant-to>
<resource path="/" include-subpaths="true"/>
</grant-to>
</policy>
</cross-domain-access>
</access-policy>
That is not normally what you want to do in production because of the security issues, but for early development it can help. Note: You can use BOTH files to get Silverlight and Flash clients to have the best experience. More details on both those files can be found at: http://msdn.microsoft.com/en-us/library/cc197955(VS.95).aspx
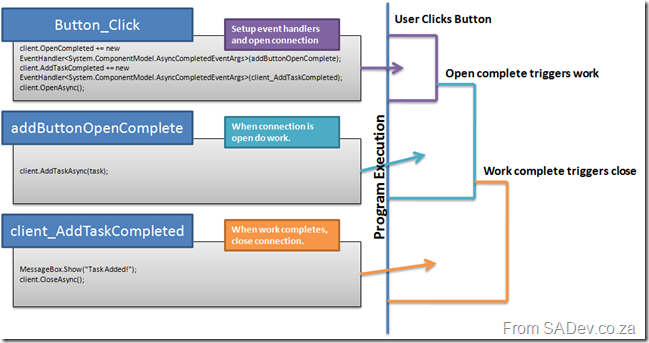
The last tip is the usage of WCF in Silverlight. It is still WCF so you are required to open and close your service connection. However since Silverlight makes web calls using async methods you need to chain up commands using events. i.e. you would create a event handler for when the connection is open and then open the connection. In the open event handler you would do the work, and once that completes you close the connection.
Chaining event handlers for getting Silverlight + WCF in code and program flow.
Special thanks to Herman (the delegator) and Willy for prompting me to write this post… especially since Herman won’t blog on this.
To Zambia with love
It started with Martin Woodward offering to send a hard drive with the 202 PDC videos on it, which arrived 3 weeks ago. That drive then got sent to Cape Town, in the care of Zlatan. Then on Thursday Chris Simusokwe stopped by the office and grabbed a copy of the videos to take back with him to Zambia! It is very cool to see how the videos recorded in LA a month ago showing the latest from Microsoft have travelled the world ;)
My sister rocks!
On Thursday night I had the honor to go to my sisters graduation! After many hard years of work and sacrifice she graduated as a teacher, specializing in foundation classes (grade 0-2 if memory serves) from Wits! I am very proud of her :) :) Next year she will be teaching at a school in Krugersdoorp!
My sister in her “batman” cloak with my mother :)
Leader of the pack - Zlatan
I am really proud to say I know Zlatan, the SharePoint MVP, S.A. Architect community lead and occasional CRM “expert” ;) because he does lead and share information with the community. So it is really great to see him listed at 59th on the top 100 SharePoint blogs (a climb of 41 places from May!). You can read more on his post. Weldone Zlatan!
Tis the season ... of surveys
My first love came back - and she now drives a Ferrari!
Seriously I am grinning like mad this morning, because my first development love has returned: DELPHI! Many years ago it stopped being a good choice for work, if you could get any work, but that changed recently with the announcement of Delphi Prism. DP makes use of Visual Studio to host the Delphi language, that’s right all the power and beauty of VS! The language has been enhanced to support all the cool things that C# can do (LINQ, Silverlight)! So that is very cool, and using Oxygene Compiler you can target .NET, Win32, Mono (so you can run on Linux) with full GUI support for GTK#, and Cocoa for OSX (Tiger and Leopard)!
That’s right one fully featured language targeting 4 different platforms (Old Windows (Win32); New Windows (.NET); Linux; Mac OSX) right from within Visual Studio!
In reality though it has just been press announcements and demo’s at PDC so nothing for me to truly base this on… but hopefully soon.
InfoQ has a nice into article on the subject too: http://www.infoq.com/news/2008/11/Delphi-Prism


