Introduction
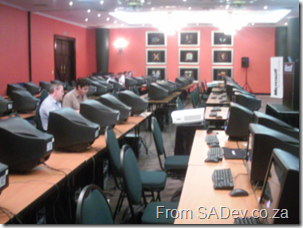
So after the drive to Emerald Casino (which took half the time I expected) and registration we started. Frikkie Bosch, marketing manager for app products (BizTalk, SQL, VS), from Microsoft is acting as facilitator for the boot camp! The actual presenter for the days is Kevin Coestzee from IS Partners. The room (pictured below) is big with space for approx. 80 people and Frikkie introduced all the companies attending at the start (lots of big names, including Microsoft staff!) and then Kevin took over and stated that the aim of the course and a brief overview of the SQL Server 2008 BI stack. It would be a level 200 course and some sections catering for business users (about 40% of the attendees) and some sections for technical (about 60% of the attendees).
The training room. This would fill up when everyone eventually arrived.
The PowerPoint section
Now that the stage is set lets look at what was covered in the mornings PowerPoint session:
First up what is BI: Taking knowledge, aggregating data and providing it to business.
BI’s use can be to understand the health of the organisation, collaborate the shared view of business drivers and reduce decision time and these are facilitated through four scenarios:
- Operational reporting
- Activity management
- Data Mart – analytics & decision making
- Data warehouse
What is the BI evolution:
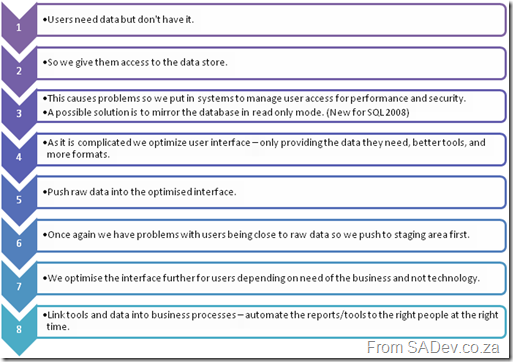
BI Evolution – I couldn’t come up with names for each stage.
What is a star schema design:
- It is a fact table with a number of linked dimensional tables. Fact tables do not link to other fact tables
A star schema.
- A dimensional table is list of unique dimensions (people, time periods, stores) with a primary key and meta data on the items. They link and support numeric data.
- A fact table combines all dimensional table primary keys with the collection of measurements associated with a business final result of process. For instance the final amounts of a sale, or salary payments. There are two ways to design it:
1) Columns layout – An individual column for each type (salary, sale etc…). Very wide layout with many columns which could be empty.
2) Single value column with a foreign key to a dimension table to designate type (salary, sale, etc…). Very narrow layout but very long and no empties.
The fact table will be the biggest table in the DB.
- This design is good for BI because
- It allows for high performance queries.
- It is designed for models.
- It is low maintenance
To me it seems similar to normalized database model.
What is a snowflake schema design:
It is a normalised version of the star schema where the dimensional table may be related to one or more other dimensional tables. Useful for hierarchy designs, like company organisation charts.
Date Dimensional Table
- Most common dimensional table created as it is used in almost every system.
- Date information is consistent across fact tables.
- Useful common attributes for the dimensional table include: year, quarter, month, day
Parent Child Dimensional Tables
There are tables which are self referring. So one column contains the primary key, while another a foreign key to the first column. Good for organizational charts, where all employees in a single table and the foreign key points to the employees manager.
Slowly Changing Dimensions
The version control system of BI ;) So they support data warehouses by providing information on the past accurately. It is a concept introduced by Ralph Kimball and is used to track changes over changes time (employee sales when they move from store 1 to store 2 etc…).
There are three types:
- Type 1: No tracking.
- Type 2: Full versioning
- Type 3: Partial versioning (current + 1 or 2 back) – Exceptionally seldom used
Type 2 is done by having a start and end date columns for the record which define when it was created and when it was superseded by a new version. If the end date is null then it is current. When a new row is inserted the old data is copied across from the old row, the changes applied and the end date set on the old row.
Type 3 is done by adding a column for the fields to be tracking to the same row and coping the old data to that column before updating the column.
What is Data Integration?
- Transform corporate data into information.
- Enterprises spend 60-80% of their BI resources in the data integration stage.
The Labs
And that ended the marathon PowerPoint slide deck! :) Now on to the first two labs focusing on SSIS, which I already know well, but I am here so I dived into them because you never know what you will find. Each lab is broken into a number of exercises and the first lab (Introduction to ETL techniques using SSIS) is made up of four exercises. Exercises 1 through 3 focused on creating a SSIS package which retrieves csv files from an FTP server and stores them locally. Those are filtered by date using a variable and then unpivot the CSV data and lookup data from dimensions and load all of it into a fact table. I really enjoyed this part, even though it is the “simple” lab is is very cool, especially since you get to read from FTP and do some parsing. The section on unpivots and derived columns (including the horrid expression that is needed) could’ve had more information and the lab should have had a way to see the data before and after.
The control flow view of the first lab.
Exercise 4 was about investigating the slowly changing dimension transform while the entire lab 2 was to manage changing data using change data capture or the MERGE statement. Unfortunately both exercise 4 and lab 2 were to me useless. The involved opening a prebuilt solution and going through each of the parts, opening the components and reviewing the settings. Normally no information on why each setting was set the way it was. There were sporadic helpings in the manual but they seemed to wane the closer to the end of the lab you got. This was especially bad for MERGE (which is new to SQL 2008, and I only know that because I read it this week in prep for a session on what’s new in SQL 2008 I am giving) which really needs more information on the use because it is so powerful. These parts really were the “nice to feature x is there” but they were more of a demo without a presenter than a lab.
One of the data flow views from the second lab.


