NDepend - The field report


I received a free copy of NDepend a few months back, which was timed almost perfectly with the start of a project I was going on to. However, before I get to that, what is NDepend?
NDepend is a static analysis tool—meaning it looks at your compiled .NET code and runs analysis on it. If you know Visual Studio code analysis or FxCop, you’re thinking of the right thing—except this isn’t about design or security rules but is more focused on the architecture of the code.
Right back to the field—the new project has gone through a few phases:
- Fire fighting: There were immediate, burning issues that needed to be resolved.
- Analysis: Now that the fires were out, we had to determine what caused them and how to prevent them going forward.
- Hand over: Getting the team who will maintain the project up to speed.
So how did NDepend help? Well, let’s look at each phase since it proved useful in different ways.
Note: The screenshots here are not from the project, since that is NDA—these are from the application I’m using in my upcoming Dev4Dev’s talk.
Fire Fighting
The codebase has over 30,000 lines of code, and the key bugs were subtle and nearly impossible to reproduce. How could I understand it quickly enough? First, I ran the entire solution and started exploring it in the Visual Explorer:
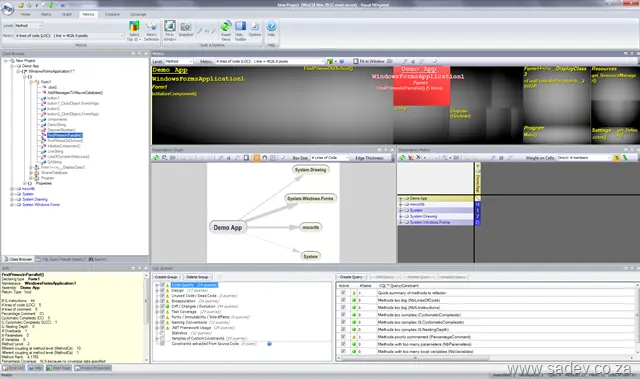
The first thing it helps with is the dependency graph in the middle, which visually shows what depends on what—not just one level, but multiple levels deep. On a large project, this could look like:
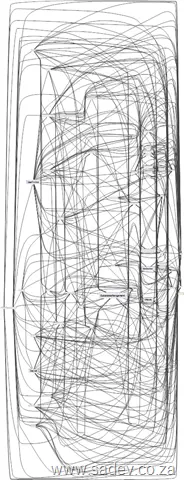
This may look overwhelming at first, but you can interact with it—zoom, click, and manipulate it—to understand what’s going on.
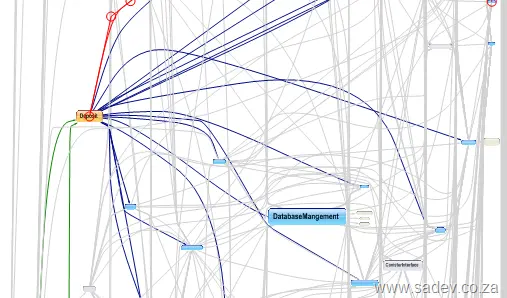
For debugging, I could sit with the customer team and quickly identify potential impact sources. That narrowed it down to libraries, but how could I refine it further? I used the metrics view (those black squares at the top of the image above). I could adjust what they represented—say, making the larger the square, the bigger the method, class, or library. Using the logic that at a certain point (around 200 lines, as per Code Complete by Steve McConnell), the bigger the method, the higher the chance of bugs. This helped prioritize where to look first, making it easier to find and resolve issues faster.
Analysis
Now that the fires were out, we moved on to analysis to prevent recurrence. When NDepend analyzes a project, it generates an HTML report with the data above—and much more—like this helpful chart showing how assemblies are used (horizontal axis) vs. how changes might affect other parts of the code (vertical axis):
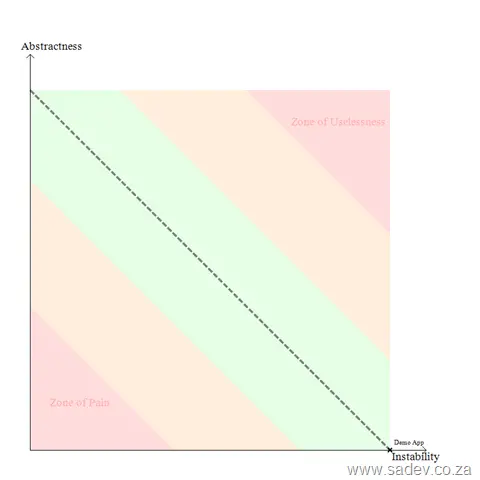
This is great for identifying refactoring priorities—or what to avoid—but there’s another powerful feature: the CQL language (like SQL for code). For example, you can query methods longer than 200 lines:
_WARN IF Count > **0**
IN SELECT TOP **10** METHODS WHERE NbLinesOfCode > **200**
ORDER BY NbLinesOfCode DESC_
Some results appear in the report, but there’s far more in the visual tool—and you can write your own queries. I even created a few to track deep inheritance in exception handling. The visual tool makes this interactive: when you run a query, it highlights the dependency tree and squares to pinpoint problem areas and hotspots.
Hand Over
In the final stages, I needed to get the long-term maintainers up to speed—without a line-by-line code review. Easy: project this on a screen and use NDepend as a presentation tool. Custom CQL queries work as slides or key points. What makes it shine is its interactivity: during discussions or Q&A, you can instantly navigate to other parts and highlight them.
All Perfect Then?
No—there are minor UI quirks (e.g., labels not showing correctly in ribbon mode, or needing to specify a project extension), but they’re manageable. The bigger issue? This isn’t a tool you can pick up and run with. I tried NDepend years ago and gave up quickly. Without immediate need or experience forcing me over the steep learning curve, I never would’ve realized its power.
That curve is steep—especially if you’re not used to metrics or architectural thinking. This isn’t a tool for every team member; it’s for architects and senior developers.