If you create a standard WCF service, it does not work with Silverlight—it needs a few tweaks to get it to work. First, Silverlight only supports connecting to a basicHTTP service and not a wsHTTP service, so you need to enable a second service or change your primary to basicHTTP. You can find out why by reading: Accessing SOAP Services
Second, you need to attribute your class with: [AspNetCompatibilityRequirements(RequirementsMode = AspNetCompatibilityRequirementsMode.Allowed)]. For example:
namespace SilverlightApplication1Web
{
   [ServiceContract(Namespace = "")]
   [AspNetCompatibilityRequirements(RequirementsMode = AspNetCompatibilityRequirementsMode.Allowed)]
   public class CustomerService
   {
      [OperationContract]
      public int CountUsers()
      {
         return 2;
      }
   }
}
The third tweak is the biggest: Normally, your WCF service and Silverlight application do not sit in the web application (either in Visual Studio or on the server), and due to the security measures in place to prevent cross-site attacks, your service calls will fail. Obviously, creating a web application with everything in it is a solution, but if you haven’t, you must add a security file to the WCF service web application. There are two files you can create in the root of your website. The first is crossdomain.xml. This format was created by Macromedia, but I do not recommend it for Silverlight scenarios, as Silverlight only supports a subset of the functionality. If you need to deal with Flash-based clients, however, this is the route you must follow. Your other option is the Microsoft way: create a file called clientaccesspolicy.xml. A clientaccesspolicy.xml file to allow all methods, from all clients, to all URLs looks like this:
<?xml version="1.0" encoding="utf-8"?>
<access-policy>
    <cross-domain-access>
        <policy>
            <allow-from http-request-headers="*">
                <domain uri="*" />
            </allow-from>
            <grant-to>
                <resource path="/" include-subpaths="true" />
            </grant-to>
        </policy>
    </cross-domain-access>
</access-policy>
That is not normally what you want in production due to security issues, but for early development, it can help. Note: You can use both files to allow Silverlight and Flash clients to work together seamlessly. More details on both files can be found at: http://msdn.microsoft.com/en-us/library/cc197955(VS.95).aspx
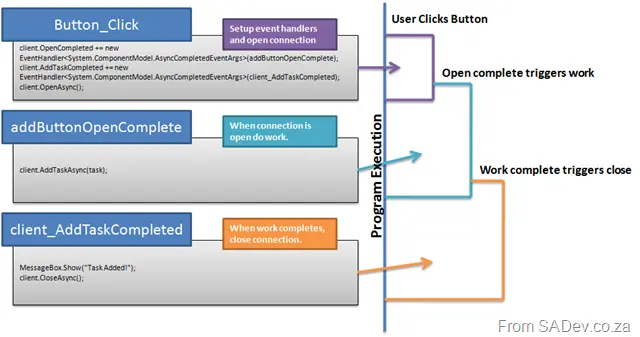
The last tip is about the usage of WCF in Silverlight. Since it’s still WCF, you are required to open and close your service connection. However, because Silverlight makes web calls using async methods, you need to chain up commands using events. For example, you would create an event handler for when the connection is opened, then open the connection. In the open event handler, you would do the work, and once that completes, you would close the connection.
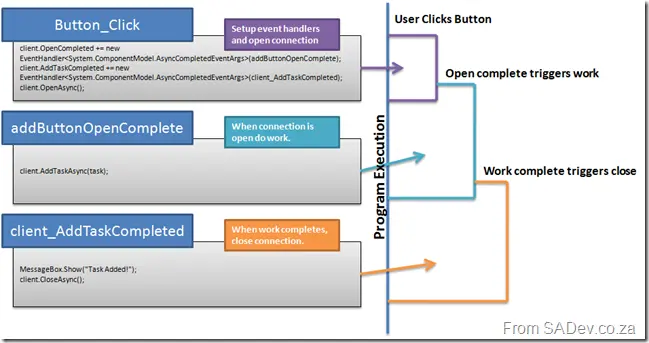
Chaining event handlers for Silverlight + WCF in code and program flow.
Special thanks to Herman (the delegator) and Willy-Peter Schaub for prompting me to write this post—especially since Herman won’t blog on this.
On Thursday night, I had the honor of attending my sister’s graduation! After years of hard work and sacrifice, she graduated as a teacher, specializing in foundation classes (grade 0–2 if memory serves) from Wits! I’m so proud of her 😊 😊 Next year, she’ll be teaching at a school in Krugersdorp!

My sister in her “Batman” cloak with my mother 😊
Ah, day 2 has arrived, so I got up at 6 to get ready and watch the emails trickle down (Emerald Casino appears to only have GPRS for Vodacom), which didn’t finish in the end. Unfortunately, this post will not be as informative as the previous two, because what I was doing was taking notes on the machine I was working on. About an hour before the end of the day, there was a power failure, and I was not able to retrieve my notes 😒 So not only did we leave early, but it was meant to be a short day to begin with—nice for a Friday to avoid traffic and get home early.
What stood out for me that day was working with PerformancePoint, a business user tool for building dashboards, KPIs, and scorecards. It was impressive how easy it was to work with—especially considering that, behind the scenes, it creates cubes and writes MDX. This is exactly what it should be. However, it is a business-user tool, so much so that Kevin (the presenter from IS Partners) mentioned how they hired four CAs in the last month and trained them to use PerformancePoint rather than training "BI people" to understand business. From speaking to some of the Microsoft people who have used it, though, the installation of PerformancePoint is exceptionally tough, and I was disappointed that it wasn’t even touched on 😒
Anyway, without my notes, it’s hard to write a long post without possibly making huge mistakes, so I’ll leave it there for what was covered.
As an event, it delivered on the initial point of being a level 200 course and helping understand the concepts—and helping business users. The problems with the labs and manual are understandable (these things happen), but considering you’re paying for this and this is a Microsoft event, it definitely should have been more professional than it felt. I would recommend this course to analysts and business users but not to development or serious BI users.
I recently had a question about layout in Reporting Services. Basically, if you use a table, you get a vertical layout, like this:
| First Name | Last Name |
|---|
| Brad | Pitt |
| Bill | Gates |
| Linus | Torvalds |
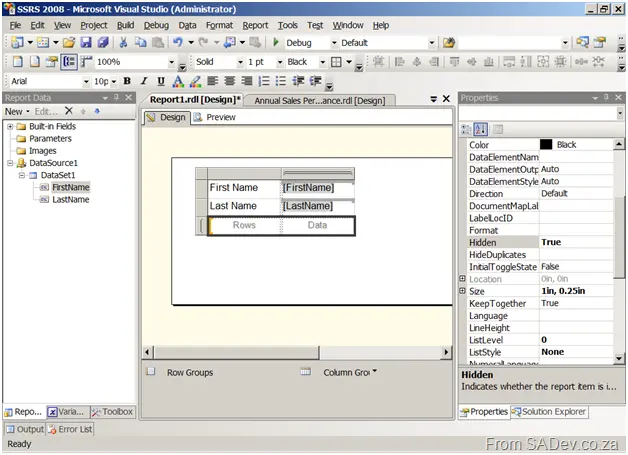
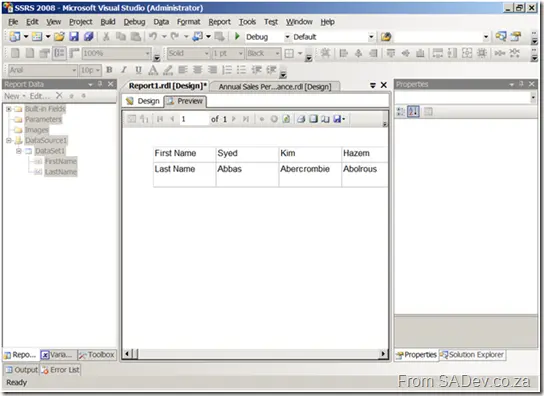
But what if you want to go horizontally? Sure, there could be UI issues because the report will get wider and wider with more data, and it could influence the quality of export or printing. But in a special scenario, it would be very useful. Unfortunately, the tablix control (Table + Matrix + List in 2008—see my post on what’s new for more info) does not offer this natively. However, using a trick, you can get around it. First, you need a tablix in matrix format (i.e., drag a matrix onto the form), and then add a new column header for each column—but instead of putting header text in there, you put the data in there. You ignore the rows and data cells (in fact, you can hide them by setting the Hidden property to true).
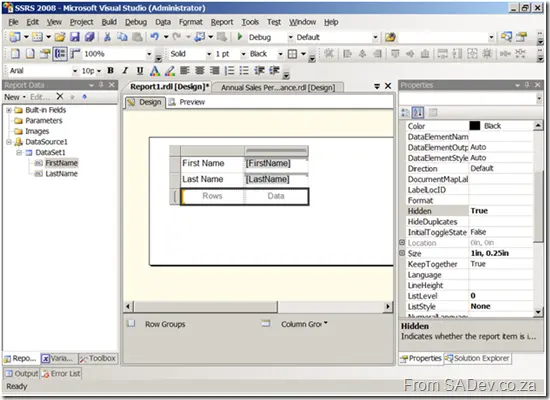
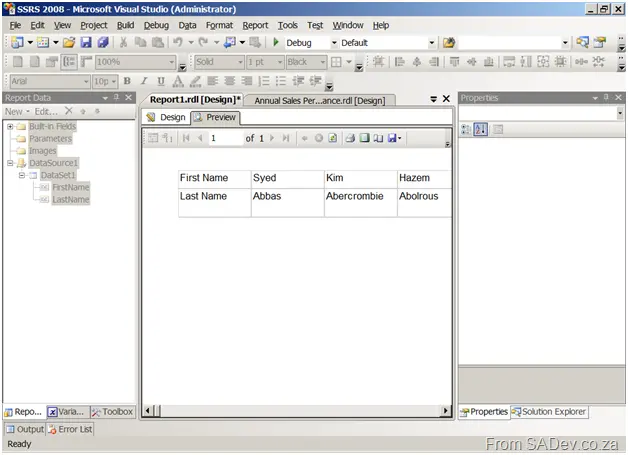
And the output is a horizontal layout of data:
Reporting Services
After lunch, we dove into the next topic I know (don’t worry—I’ll learn stuff later in the day), namely Reporting Services 😊 So we started with the PowerPoint again :| I’m not repeating everything he said, since a lot is covered in my earlier post on reporting services.
First, where are reports used?
- Internal reporting – operational & management
- External – to customers
- Embedded – Portals, Windows, and Web
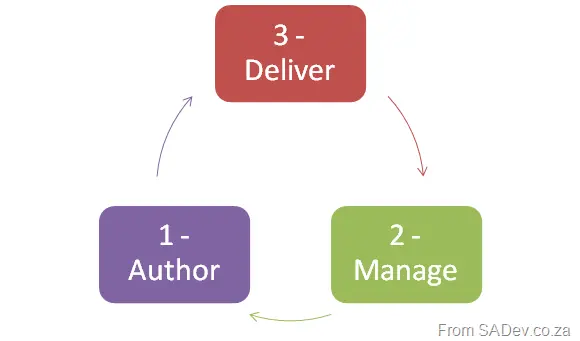
The lifecycle of report development is:
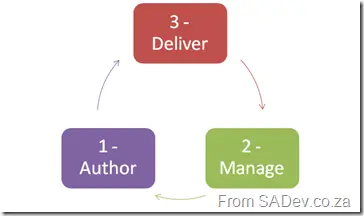
Reporting lifecycle – Once again, no clever names (I should work on that).
Some notes on RS that I never knew:
- Data-driven subscriptions are an enterprise edition-only feature 😒
- Drill-through is only enabled for reports rendered into HTML (wonder why PDF doesn’t support it).
Reporting Services Labs
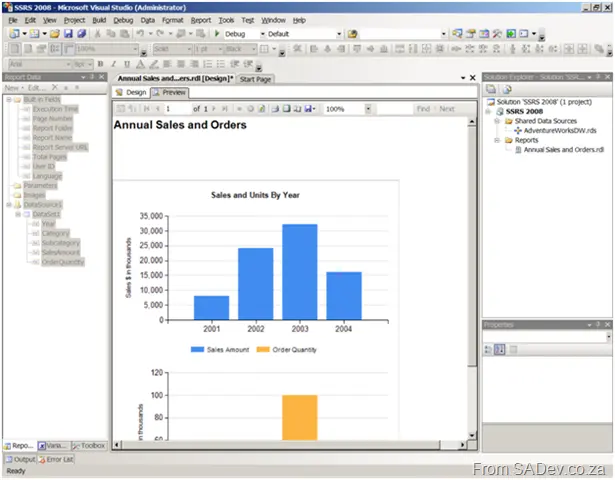
Right after the slides were put away, we jumped into the first lab… or rather, we didn’t, because Report Builder 2.0 wasn’t installed on the machines 😒 Skipping over Lab 1, we moved to Lab 2, where we created a simple report with a chart control. I enjoyed this lab, even though it was fairly simple.
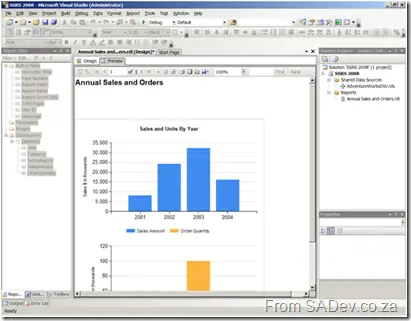
The report from Exercise 1. Note the two charts—but it’s a single chart control. Thanks, Dundas 😊
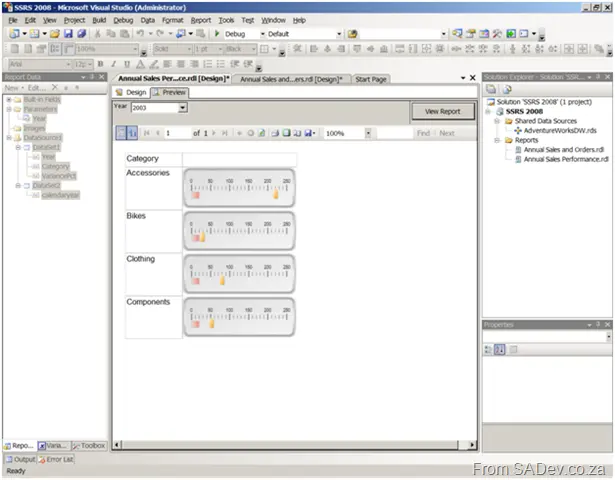
For Exercise 2, we created a report with gauges:
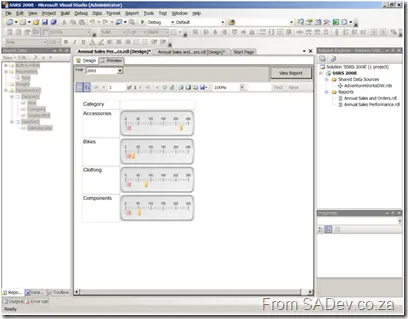
The report from Exercise 2.
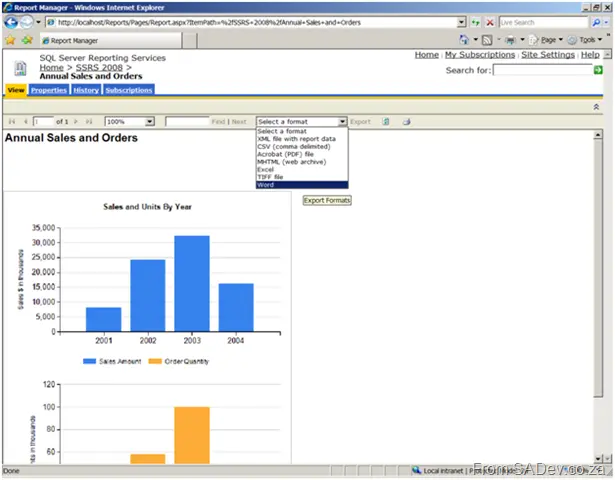
The third exercise involved publishing to a Reporting Services (RS) server from Visual Studio and then exporting to Word.
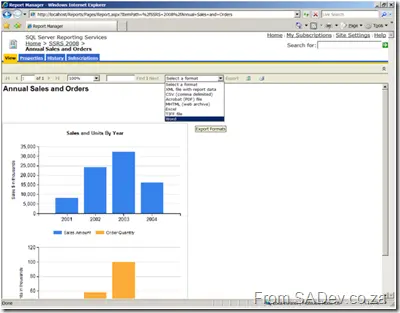
The report about to be exported in Exercise 3.
All in all, I found the RS labs very enjoyable—though not quite at the advertised level for a 200-level course.
Introduction to UDM
With that out of the way, we moved on to UDM (the SQL Server 2005/2008 name for a cube). UDM stands for Unified Dimensional Model.
For UDM, you use OLAP (Online Analytical Processing), which retrieves data from one or many databases and presents it in a way that’s easy for analysis.
Uses of OLAP
- Sales analysis
- Forecasting and budgeting
- Financial reporting
- Web statistics
- Survey results
- ETL process analysis
SQL Server Analysis Services (SSAS) includes an OLAP component and a data mining component. Basic data mining is also available for free in Excel (separate download).
Building a cube provides users with more functionality, enables high-performance queries, abstracts multiple data sources, and encapsulates business rules.
Now that the introduction was done, we moved on to the labs. The first lab required building a cube—which seemed to have way too many steps (maybe I’m just a lazy developer). It quickly turned into an exercise in following a manual rather than understanding why each step was necessary. One comment I overheard was that it felt like a lot of work just to build a pivot table, since that’s all we ended up with. I think that highlighted the lack of context around the process :/
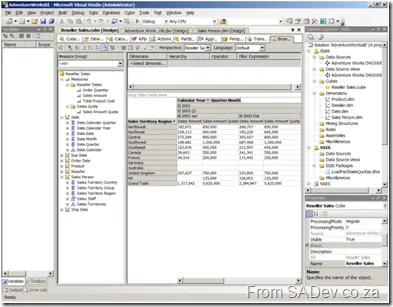
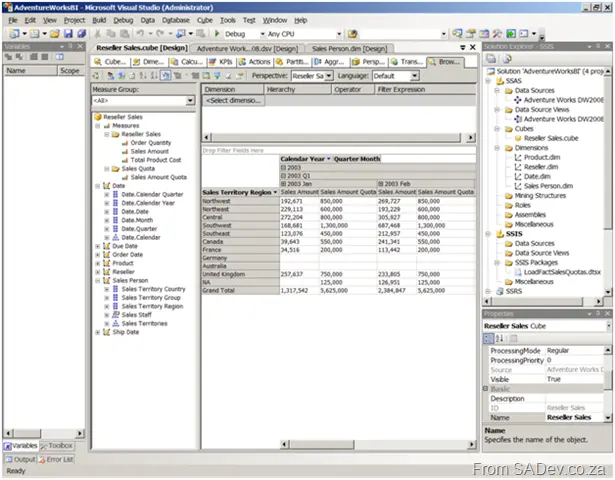
Using the data browser in the cube we built.
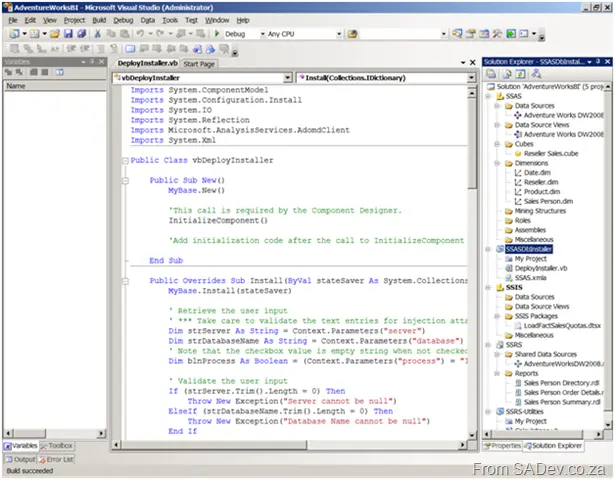
Then we fired up Visual Basic :shock: to build an installer for the cube so it could be deployed across multiple servers easily. This was interesting—mostly because I’ve spent a lot of time with MSI in the past but never really mastered the advanced features (like embedding VB code).
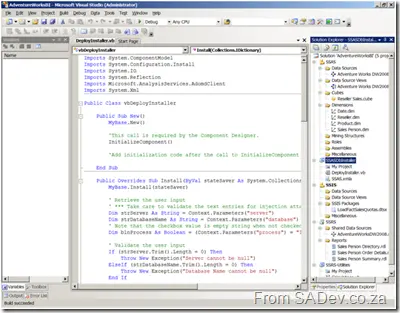
My VB code! (Actually, it’s copy-pasted from the snippets file.)
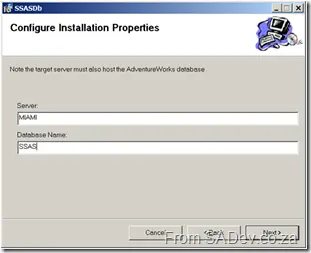
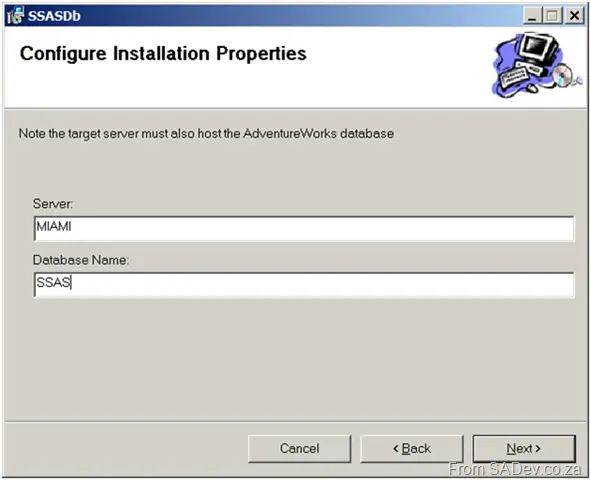
Deploying my cube using the installer.
We were given 75 minutes to complete the lab, and the manual claimed it should take exactly that long (I finished in 71). However, no extra time was allocated for:
- Lab 2 (estimated 45 min),
- Lab 3 (estimated 15 min), or
- Lab 4 (also estimated 15 min).
That meant unless you were already familiar with the material, you couldn’t finish more than 50% of the labs 😒
Introduction to MDX
After the cubes, we moved on to MDX (Multidimensional Expressions), a language similar to SQL but optimized for analyzing data in cubes. Its specifications are based on OLEDB for OLAP (ODBO) or XML/A.
Since MDX is a development tool (not an end-user tool), the skills needed to learn it include:
- Helpful: SQL skills, Excel (formulas)
- Not helpful: C# or ASP.NET
What does MDX look like? SELECT <Filters> FROM <Cube or subquery> WHERE <Slicer>
SQL vs. MDX
- In SQL, results are defined by columns populating rows, while in MDX, they’re defined by rows, columns, and populated cells.
- In SQL, row headings are data; in MDX, they’re schema.
- SQL aggregates dynamically into groups, while MDX references data by cell sets.
What is an MDX Set? A grouping of items using standard set notation: { … }
You can format results (e.g., currency, thousand separators) in cells using the CELL FORMATTING statement.
Tuple – A list of members from different hierarchies separated by commas. Pronounced: Too-ple (like quadruple). These go in the <Filters> and <Slicer> sections of an MDX query.
Imagine these three tables:
- Towns:
- Values:
- Sales People:
You could build the following tuples:
- All sales for CT:
(CT, SALES) or (SALES, CT) ← Order doesn’t matter. - All sales for JHB and CT:
(CT, SALES) + (JHB, SALES) - All JIM’s sales in CT and JACK’s sales in JHB:
(CT, SALES, JIM) + (JHB, SALES, JACK) (Note: This excludes JIM’s sales in JHB and JACK’s sales in CT.)
Types of Tuples:
- Complete tuple: References every dimension.
- Partial tuple: Omits some dimensions. Uses the current member if a dimension is omitted.
MDX tuples have functions like:
- Percentage of parent
- PrevMember
- ParallelPeriod
- Children
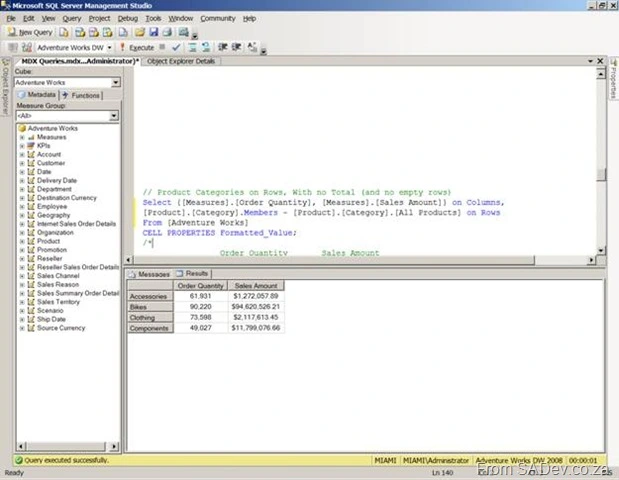
After covering MDX, we did a lab where we fixed 10 broken queries. This was refreshing—they provided broken examples, and we had to apply our knowledge (and the help files) to fix them. It was a great way to learn! At first, it was frustrating because MDX is different from SQL, but more labs should be structured like this. I got some right and got stuck on others—I had to peek at the answers to figure out a few.
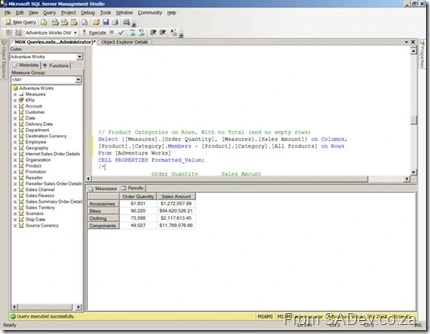
One of the MDX queries I fixed.
By now, it was after 6 PM, so we checked in, headed for dinner, and drinks.
Introduction
So after the drive to Emerald Casino (which took half the time I expected) and registration, we started. Frikkie Bosch, marketing manager for app products (BizTalk, SQL, VS), from Microsoft is acting as facilitator for the boot camp! The actual presenter for the days was Kevin Coestzee from IS Partners. The room (pictured below) is big, with space for approximately 80 people. Frikkie introduced all the companies attending at the start (lots of big names, including Microsoft staff!), and then Kevin took over to state the aim of the course and provide a brief overview of the SQL Server 2008 BI stack. It would be a level-200 course, with sections catering to business users (about 40% of the attendees) and sections for technical users (about 60% of the attendees).
[ ]
]
The training room. This would fill up when everyone eventually arrived.
The PowerPoint section
Now that the stage is set, let’s look at what was covered in the morning’s PowerPoint session:
What is BI? Taking knowledge, aggregating data, and providing it to business users.
BI’s use can be to understand the health of the organization, collaborate on a shared view of business drivers, and reduce decision time. These are facilitated through four scenarios:
- Operational reporting
- Activity management
- Data Mart – analytics & decision making
- Data warehouse
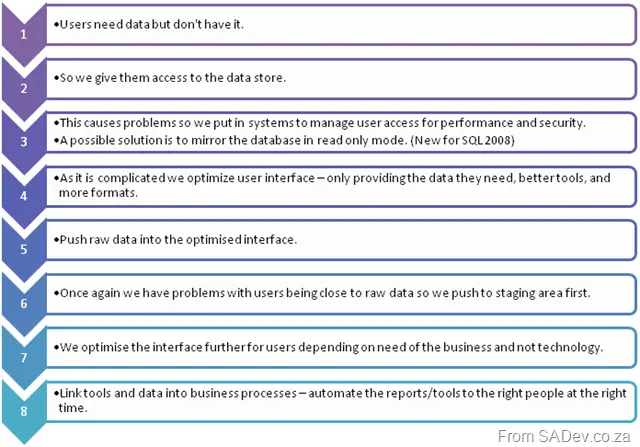
What is the BI evolution?
What is a star schema design?
- It is a fact table with a number of linked dimensional tables. Fact tables do not link to other fact tables.
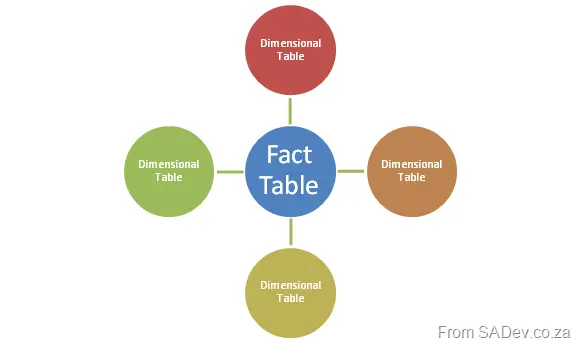
A star schema.
- A dimensional table is a list of unique dimensions (people, time periods, stores) with a primary key and metadata on the items. They link and support numeric data.
- A fact table combines all dimensional table primary keys with the collection of measurements associated with a business process’s final result—for instance, the final amounts of a sale or salary payments. There are two ways to design it:
- Columns layout – An individual column for each type (salary, sale, etc.). Very wide layout with many columns, which could be empty.
- Single value column with a foreign key to a dimension table to designate type (salary, sale, etc.). Very narrow layout but very long, with no empties.
- The fact table will be the biggest table in the database.
- This design is good for BI because:
- It allows for high-performance queries.
- It is designed for models.
- It is low maintenance.
To me, it seems similar to a normalized database model.
What is a snowflake schema design? It is a normalized version of the star schema, where the dimensional table may be related to one or more other dimensional tables. Useful for hierarchy designs, like company organization charts.
Date Dimensional Table
- The most common dimensional table created, as it is used in almost every system.
- Date information is consistent across fact tables.
- Useful common attributes for the dimensional table include: year, quarter, month, day.
Parent-Child Dimensional Tables There are tables that are self-referencing—so one column contains the primary key, while another contains a foreign key to the first column. This works well for organizational charts, where all employees are in a single table and the foreign key points to the employee’s manager.
Slowly Changing Dimensions The version control system of BI! So they support data warehouses by providing accurate information on the past. This concept was introduced by Ralph Kimball and is used to track changes over time (e.g., employee sales when they move from store 1 to store 2).
There are three types:
- Type 1: No tracking.
- Type 2: Full versioning
- Type 3: Partial versioning (current + 1 or 2 back)—exceptionally seldom used
Type 2 is done by adding start and end date columns to the record, which define when it was created and when it was superseded by a new version. If the end date is null, it is current. When a new row is inserted, the old data is copied across from the old row, the changes applied, and the end date set on the old row.
Type 3 is done by adding a column for the fields to be tracked to the same row and copying the old data to that column before updating the column.
What is Data Integration?
- Transform corporate data into information.
- Enterprises spend 60–80% of their BI resources in the data integration stage.
The Labs
And that ended the marathon PowerPoint slide deck! 😊 Now on to the first two labs focusing on SSIS, which I already know well—but I’m here, so I dived into them because you never know what you’ll find. Each lab is broken into a number of exercises, and the first lab (Introduction to ETL techniques using SSIS) consists of four exercises.
Exercises 1 through 3 focused on creating a SSIS package that retrieves CSV files from an FTP server and stores them locally. These files are filtered by date using a variable, then unpivoted, with lookup data from dimensions, and loaded into a fact table. I really enjoyed this part—even though it’s the “simple” lab, it’s very cool, especially since you get to read from FTP and do some parsing. The section on unpivots and derived columns (including the horrid expression needed) could have used more information, and the lab should have had a way to see the data before and after.
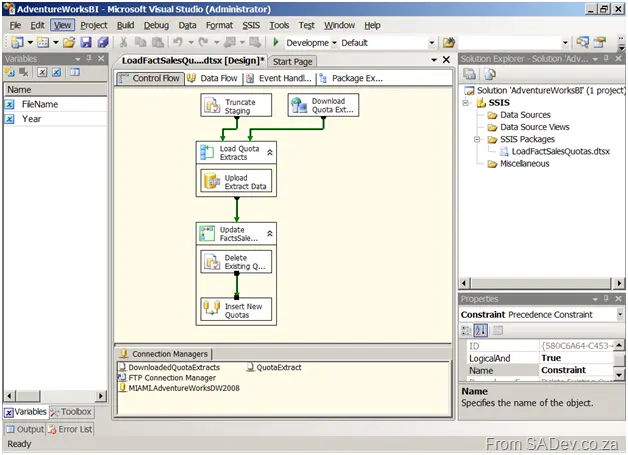
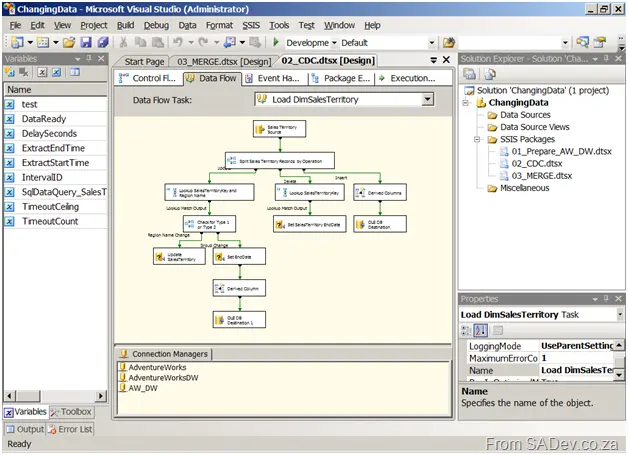
Exercise 4 was about investigating the slowly changing dimension transform, while the entire second lab focused on managing changing data using change data capture or the MERGE statement. Unfortunately, both Exercise 4 and Lab 2 were, to me, useless. They involved opening a prebuilt solution and going through each part, opening the components, and reviewing the settings—usually without explanation of why each setting was the way it was. There were sporadic hints in the manual, but they seemed to dwindle the closer you got to the end of the lab. This was especially true for MERGE (which is new to SQL Server 2008—I only know that because I read about it this week in prep for a session on what’s new in SQL Server 2008 I’m giving), which really needs more information on its use because it’s so powerful. These parts were more of a demo without a presenter than an actual lab.
I thought I would share some tips and tricks for improving the search experience with SharePoint:
| In any company, you will have people of different backgrounds and skills using SharePoint, and one of the first issues is that search isn’t fine-grained enough, and that users either don’t know or don’t feel comfortable with advanced search features to get it fine-grained. To make “normal” search easier, just add Faceted Search. If you are interested in what that is, go and check out the site. Next, improve usage by lighting up SharePoint search to browsers. Well, what does that mean? It means that when you go to a website with a modern browser, it “detects” the search functionality and allows you to add it to the built-in search functions in your browser, so you can search the SharePoint site from your browser without even going to it first! It does this using an open standard called Open Search. To do this, you first need to define an XML file that tells the browser what to do. Example: 
Really simple—basically, just the name and the encoding. The magic is handled by replacing the tag in the URL ({searchTerms}) with what the user is searching for. That file needs to be uploaded to a location on the SharePoint site where it can be read by users. The next step is exposing it to browsers; to do this, you just need to add a line to the <head> tag in your master page:
<link rel="search" type="application/opensearchdescription+xml" href="/search/searchdefinition.xml" title="BB&D Portal" />
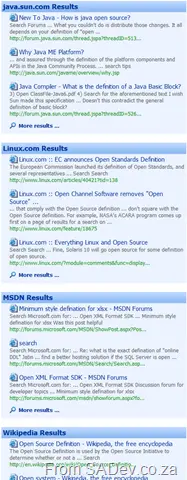
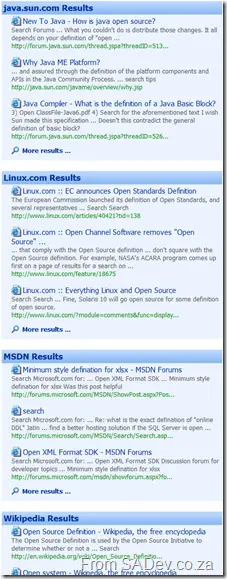
Now the browsers will see the tag and light up the search facility! This is really helpful for improving adoption of search. Next up, it would be great to search multiple locations, and you can thanks to a feature in SharePoint called federated search. With this feature, your search query actually calls other websites for results and places them in a special section of the site, defined by a web part. As I am personally interested in a lot of technologies, I think it would be great to have federated search to: Wikipedia, Linux.com, Java.Sun.com, MSDN.Microsoft.com, and TechNet.Microsoft.com, like shown on the left.
What you may notice is that MSDN already has support for federated search, but the rest don’t! So how do you get around that? Well, Live.com also has support for federated search and also supports limiting results to a specific site. So all that is needed is to create a search provider configuration for Live.com and limit it to the specified website. You can download the sample providers I created below:
|  |
|
The last tip is to implement a very clean landing page for the site with a search box on it. As the new landing page is cleaner and smaller than the rest, the initial feeling of SharePoint is that it is quicker and more responsive, and so it also improves adoption. To get the search box to search properly using just a tiny bit of HTML + JavaScript—which looks like this (assuming you have a textbox with an ID called query)—this will create the button:
<input type="button" width="100px" value="Search" onclick="window.location='/pages/SearchResults.aspx?k='+document.getElementById('query').value+'&s=All%20Sites';" />
On Friday Willy publicly announced his plans for 2009, which include leaving South Africa to go and work for the big blue monster (aka Microsoft) in the Rangers team!
Before I get into my view on this, let me explain what the Rangers are:
An MVP (a Microsoft Most Valuable Professional, which Willy is) is selected from the community by the community and Microsoft as an expert, lead, or guide in their field. They are the best of the best outside of Microsoft. The Rangers are the internal version of MVPs—they are the best of the best inside Microsoft. It’s a great honor and privilege, and it shows just how big an expert Willy is.
In short, I’m so happy for him (and a little jealous too), but in the short time I’ve worked with him, I’ve barely scratched the surface of what he knows… so I’m sad I won’t get that on a day-to-day basis.
To Willy, I wish you the best of luck and enjoyment in this new experience!
This is a multi-part series. The other parts can be found at:
In part II, I wrote about how to get the data out of SharePoint dynamically using a custom ASP.NET web page that did the hard work for us. The last part of this series is getting that code to work on the SharePoint server. The first step is to create a folder on the server where you will put these files (available at the end of the post). This should be outside your SharePoint directory—something like C:\inetpub\wwwroot\addons would be a good place. Next, you need to create a virtual directory on your SharePoint site in IIS that points to that folder. The defaults for the virtual directory will be fine, but from a safety point of view, I would recommend running it in its own application pool.
If you just create an ASP.NET application and put it there, it would fail because the SharePoint web.config file does some odd things. To work around that, you need to make a few changes to it. First, clear all the inherited assemblies (see line 6 below); this has the downside that all the defaults from machine.config also disappear, so you need to add the ones you need back (lines 7 to 13). Next, clear all inherited httpModules (see line 19), and lastly, increase the trust of this application to Full (line 21). Since this is on a virtual directory, you have the advantage of not messing with the SharePoint config, and your SharePoint server will continue to run happily.
   1: <?xml version="1.0"?>
   2: <configuration>
   3:     <system.web>
   4:         <compilation debug="true">
   5:             <assemblies>
   6:                 <clear/>
   7:                 <add assembly="System, Version=2.0.0.0, Culture=neutral, PublicKeyToken=B77A5C561934E089"/>
   8:                 <add assembly="System.Drawing, Version=2.0.0.0, Culture=neutral, PublicKeyToken=b03f5f7f11d50a3a"/>
   9:                 <add assembly="System.Web, Version=2.0.0.0, Culture=neutral, PublicKeyToken=b03f5f7f11d50a3a"/>
  10:                 <add assembly="System.Web.Services, Version=2.0.0.0, Culture=neutral, PublicKeyToken=b03f5f7f11d50a3a"/>
  11:                 <add assembly="System.Xml, Version=2.0.0.0, Culture=neutral, PublicKeyToken=B77A5C561934E089"/>
  12:                 <add assembly="System.Core, Version=3.5.0.0, Culture=neutral, PublicKeyToken=B77A5C561934E089"/>
  13:                 <add assembly="ListMonkey"/>
  14:             </assemblies>
  15:         </compilation>
  16:         <authentication mode="Windows"/>
  17:         <customErrors mode="Off"/>
  18:         <httpModules>
  19:             <clear/>
  20:         </httpModules>
  21:         <trust level="Full"/>
  22:     </system.web>
  23: </configuration>
That is really all the configuration you need for the application to run. However, don’t forget the config for Slide.Show to run, which we looked at in parts I and II.
Next, let’s briefly look at how the application works. Firstly, override the Render method of the ASP.NET page. Inside, I do a lot of validation of the inputs provided in the query string. This is also an opportunity to set defaults if certain values are not provided. Next—and very importantly—I set the output to be text/xml (this tells the client, in our case JavaScript, what to expect). To do this, I do:
Response.ContentType = "text/xml";
Then I call the SharePoint lists web service, which returns the results. These are parsed and rendered to XML (I’m unfortunately still using XmlNode when I wrote this, instead of the beautiful XElement stuff… but I digress), and output to the screen using:
Response.Write(outputDocument.OuterXml);
This XML is in the format Slide.Show expects, so its configuration system—which we set up last time—can just use it! All of this gives us a real-time integration into SharePoint with Slide.Show! 😊
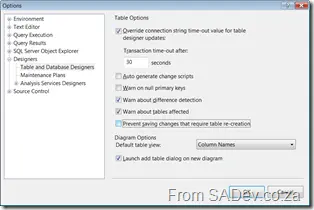
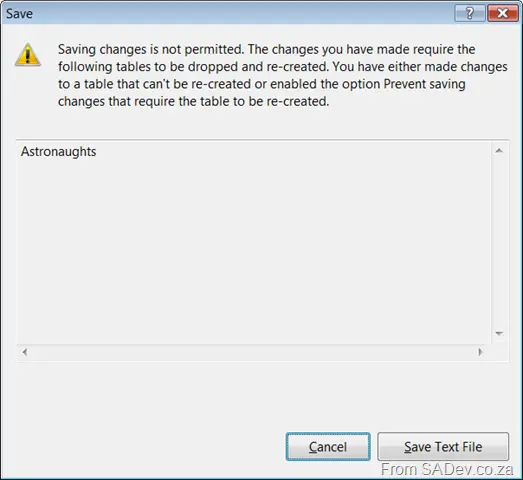
I was working on a database for some sample data a few weeks back using SQL Server 2008 for the first time. I initially configured the table in one way and decided to change it later, because I wanted to do something else with the data. However, when I tried to save it, I got the following message:
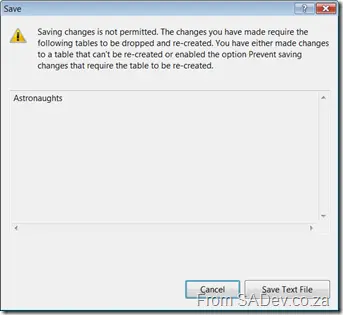
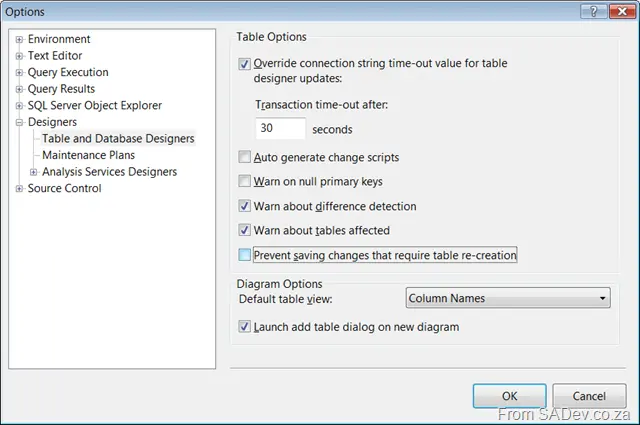
As there was no data in yet, I wasn’t worried about tables being dropped and recreated, so I needed to enable the option mentioned in the message. The option can be found in the Options menu item (duh!) under Designers → Table and Database Designers. You need to uncheck the option Prevent saving changes that require table re-creation and click OK!