What does a developer user group attendee look like?


Someone who attends the awesome developer user group (DUG) is 26–35 years old, a senior C# developer, not looking for a new job, and works on websites or mobile apps at a company of 10 people or less—statistically speaking. This is what came out in the recent DUG annual survey. This was the second time we ran the survey (2014 results can be found here), and we tried to keep the questions similar so we could compare. The goal of the survey is ultimately to understand the audience better so we can give it a better event.
Satisfaction
For us, as the leads of the group, the satisfaction numbers are very important, and we’re very happy to see a small uptick in them.
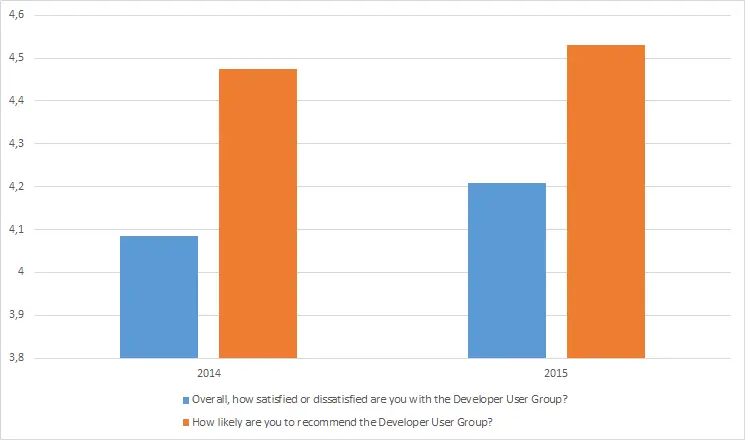
As for the complexity of sessions, it’s still near the middle but slightly higher, meaning they’re a bit more complex than last year.
Start Time
Going into last year’s survey, the start time for Johannesburg was a big discussion point: What time should the group start? Last year, 49% of people wanted it to remain as-is, 6% wanted it earlier, and 45% wanted it later. This year, those numbers have shifted: 57% want to keep it the same, none want it earlier, and 43% prefer a later time.
This year, we also have Pretoria data, and the picture is very different: only 37% are happy with the current time, while 63% want an earlier one. There’s no clear winner for the earlier time—16h30, 17h30, and 18h00 all received the same number of votes. Moving forward, this group will shift to an earlier time, so we hope to see an improvement next year.
Why Do You Attend?
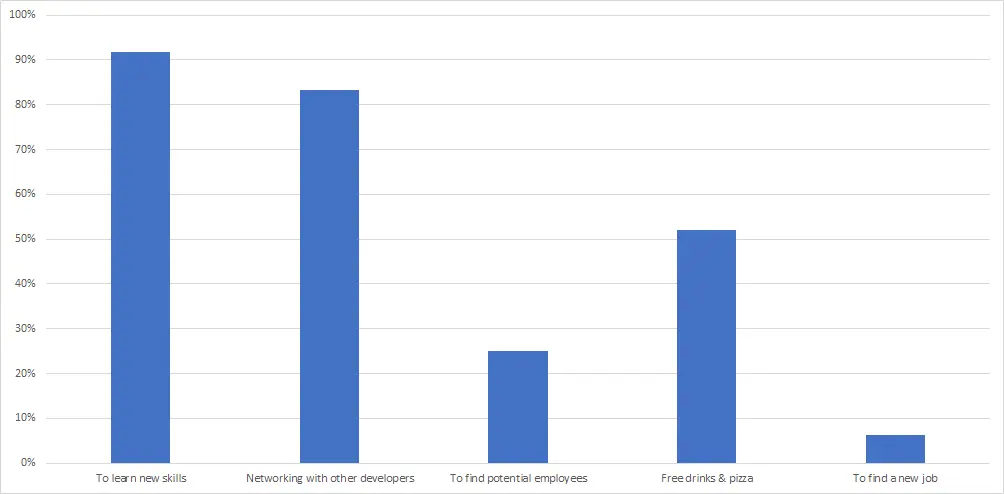
Attendance is largely about skill development and networking, and for the most part, these numbers are similar to last year. The only interesting changes are around employment: those not looking for a job have decreased by 6%, while those looking for work have increased by around 5%.
Demographics
Breaking down the details of the group, starting with age:
- 18–25: 10%
- 26–35: 58%
- 36–45: 26%
- 46–55: 4%
- 56–65: 2%
Skill level:
- Senior: 67%
- Intermediate: 18%
- Junior: 14%
We’ve seen an increase in juniors since 2014—great trend!
Languages:
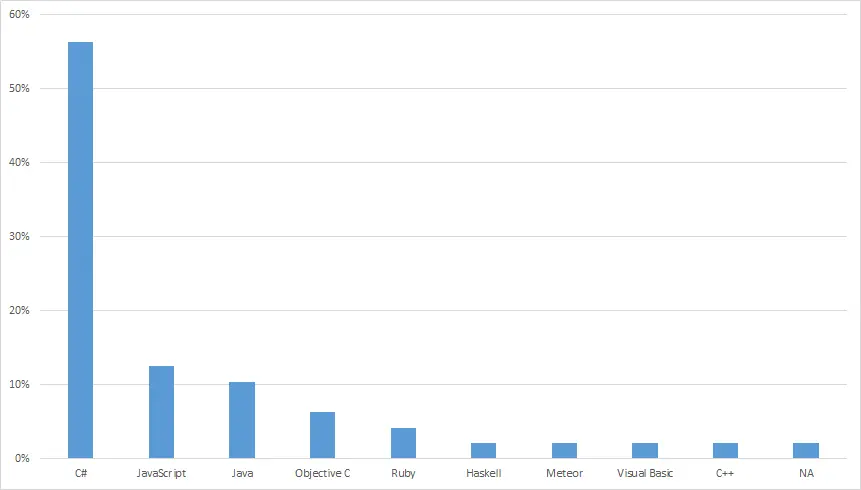
Compared to 2014, the declining languages are:
- C# (down 3%)
- C++ (down 1%)
- Python, PHP, Scala, SQL (each down 1%, now dropping away completely)
The rising languages are:
- Java (up 1%)
- JavaScript (up 9%)
- Objective-C (up 5%)
- VB (up 1%)
- Ruby, Haskell, and Meteor (all new at 2% this year)
What work are we doing?
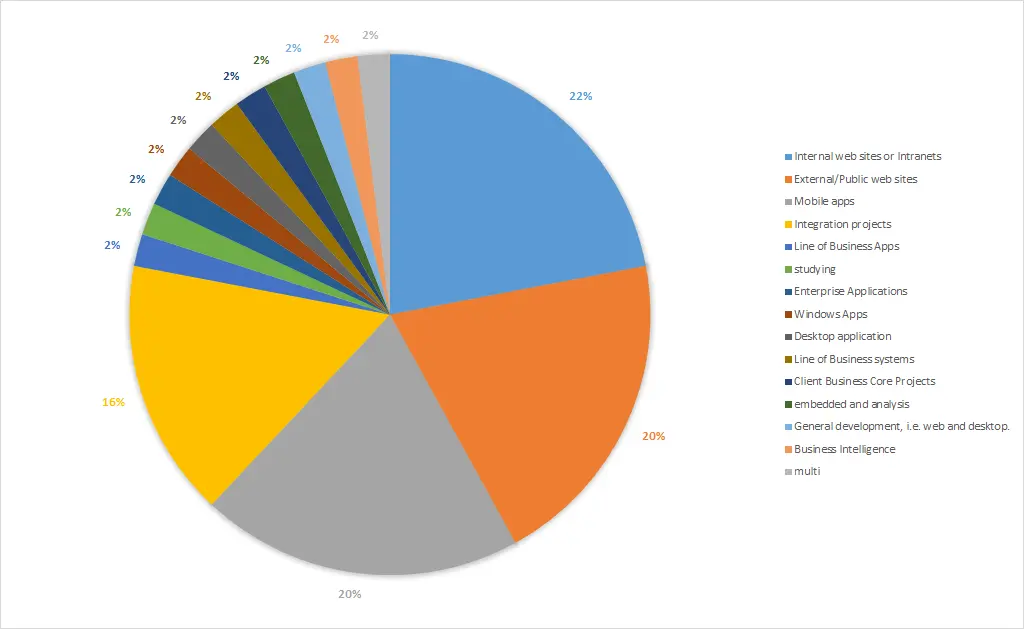
There’s a trend away from web technology: internal websites are down 8%, public-facing websites 7%, while mobile development is up 9%.
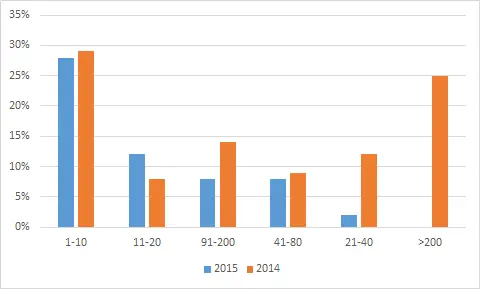
Company size:
- 1–10 employees: 28%
- 11–20 employees: 12%
- 91–200 employees: 8%
- 41–80 employees: 8%
- 21–40 employees: 2%
- >200 employees: 0%
Role in purchasing:
- Can suggest/influence purchases: 40%
- None: 42%
- Final say: 18%
Comments
Most comments were positive and supportive—thank you! One trend that stood out was video recording the sessions. This is something we’re investigating, and we want to offer these videos with a reliable system. It’s not an easy problem to solve, but we’re working on it.
Raw Data
If you’d like to explore the data yourself, you can find it below.