SQL BI Boot Camp - Day 1: Afternoon Session


Reporting Services
After lunch, we dove into the next topic I know (don’t worry—I’ll learn stuff later in the day), namely Reporting Services 😊 So we started with the PowerPoint again :| I’m not repeating everything he said, since a lot is covered in my earlier post on reporting services.
First, where are reports used?
- Internal reporting – operational & management
- External – to customers
- Embedded – Portals, Windows, and Web
The lifecycle of report development is:
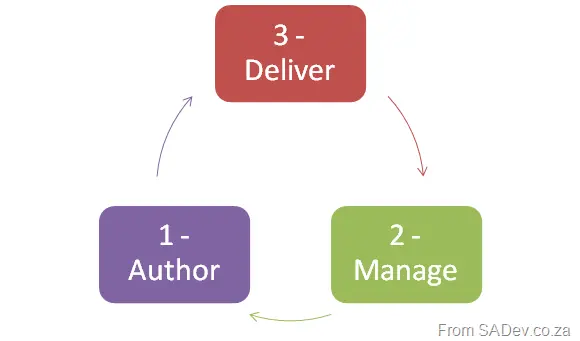
Reporting lifecycle – Once again, no clever names (I should work on that).
Some notes on RS that I never knew:
- Data-driven subscriptions are an enterprise edition-only feature 😒
- Drill-through is only enabled for reports rendered into HTML (wonder why PDF doesn’t support it).
Reporting Services Labs
Right after the slides were put away, we jumped into the first lab… or rather, we didn’t, because Report Builder 2.0 wasn’t installed on the machines 😒 Skipping over Lab 1, we moved to Lab 2, where we created a simple report with a chart control. I enjoyed this lab, even though it was fairly simple.
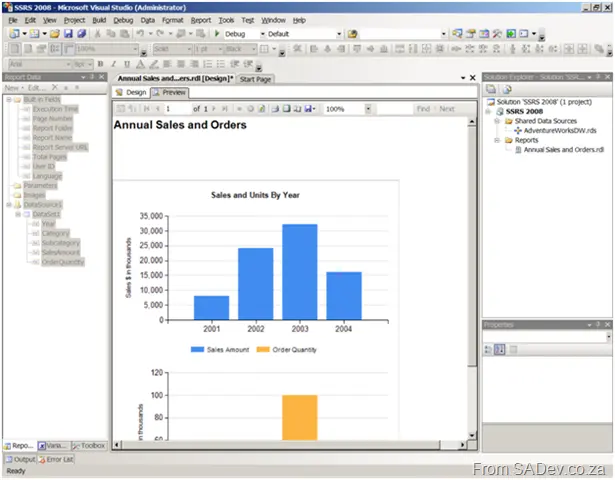
The report from Exercise 1. Note the two charts—but it’s a single chart control. Thanks, Dundas 😊
For Exercise 2, we created a report with gauges:
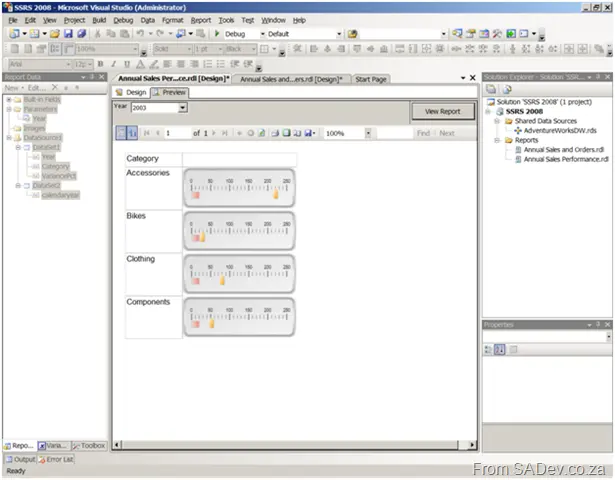
The report from Exercise 2.
The third exercise involved publishing to a Reporting Services (RS) server from Visual Studio and then exporting to Word.
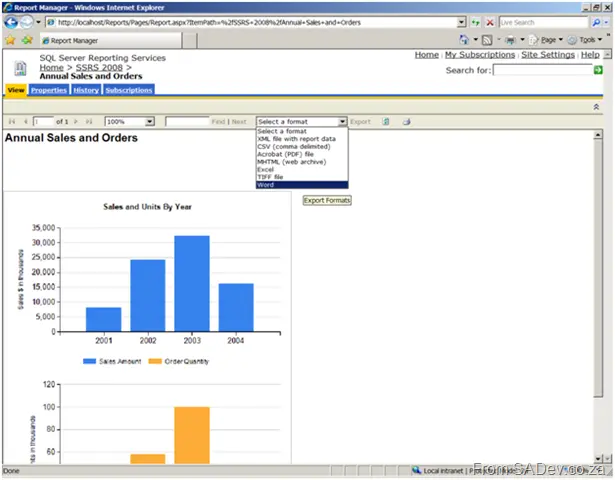
The report about to be exported in Exercise 3.
All in all, I found the RS labs very enjoyable—though not quite at the advertised level for a 200-level course.
Introduction to UDM
With that out of the way, we moved on to UDM (the SQL Server 2005/2008 name for a cube). UDM stands for Unified Dimensional Model.
For UDM, you use OLAP (Online Analytical Processing), which retrieves data from one or many databases and presents it in a way that’s easy for analysis.
Uses of OLAP
- Sales analysis
- Forecasting and budgeting
- Financial reporting
- Web statistics
- Survey results
- ETL process analysis
SQL Server Analysis Services (SSAS) includes an OLAP component and a data mining component. Basic data mining is also available for free in Excel (separate download).
Building a cube provides users with more functionality, enables high-performance queries, abstracts multiple data sources, and encapsulates business rules.
Now that the introduction was done, we moved on to the labs. The first lab required building a cube—which seemed to have way too many steps (maybe I’m just a lazy developer). It quickly turned into an exercise in following a manual rather than understanding why each step was necessary. One comment I overheard was that it felt like a lot of work just to build a pivot table, since that’s all we ended up with. I think that highlighted the lack of context around the process :/
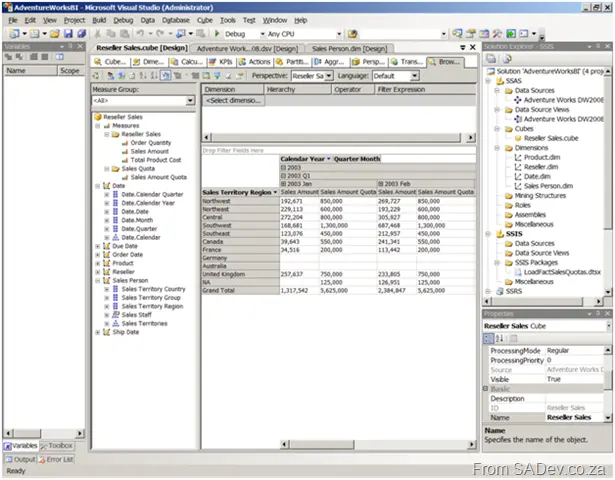
Using the data browser in the cube we built.
Then we fired up Visual Basic :shock: to build an installer for the cube so it could be deployed across multiple servers easily. This was interesting—mostly because I’ve spent a lot of time with MSI in the past but never really mastered the advanced features (like embedding VB code).
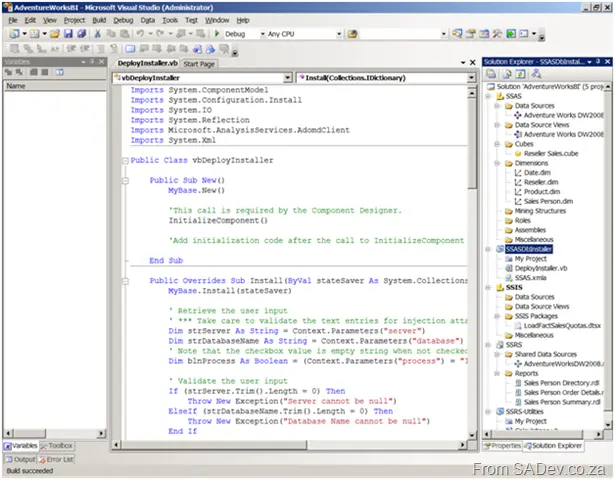
My VB code! (Actually, it’s copy-pasted from the snippets file.)
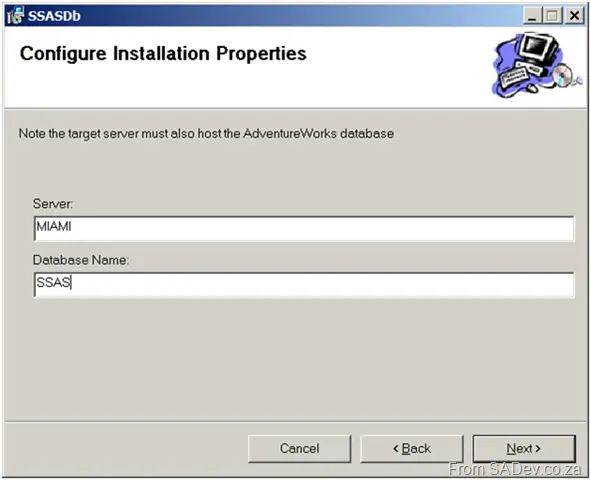
Deploying my cube using the installer.
We were given 75 minutes to complete the lab, and the manual claimed it should take exactly that long (I finished in 71). However, no extra time was allocated for:
- Lab 2 (estimated 45 min),
- Lab 3 (estimated 15 min), or
- Lab 4 (also estimated 15 min).
That meant unless you were already familiar with the material, you couldn’t finish more than 50% of the labs 😒
Introduction to MDX
After the cubes, we moved on to MDX (Multidimensional Expressions), a language similar to SQL but optimized for analyzing data in cubes. Its specifications are based on OLEDB for OLAP (ODBO) or XML/A.
Since MDX is a development tool (not an end-user tool), the skills needed to learn it include:
- Helpful: SQL skills, Excel (formulas)
- Not helpful: C# or ASP.NET
What does MDX look like? SELECT <Filters> FROM <Cube or subquery> WHERE <Slicer>
SQL vs. MDX
- In SQL, results are defined by columns populating rows, while in MDX, they’re defined by rows, columns, and populated cells.
- In SQL, row headings are data; in MDX, they’re schema.
- SQL aggregates dynamically into groups, while MDX references data by cell sets.
What is an MDX Set? A grouping of items using standard set notation: { … }
You can format results (e.g., currency, thousand separators) in cells using the CELL FORMATTING statement.
Tuple – A list of members from different hierarchies separated by commas. Pronounced: Too-ple (like quadruple). These go in the <Filters> and <Slicer> sections of an MDX query.
Imagine these three tables:
- Towns:
- CT
- JHB
- Values:
- SALES
- COS
- Sales People:
- JIM
- JACK
You could build the following tuples:
- All sales for CT:
(CT, SALES)or(SALES, CT)← Order doesn’t matter. - All sales for JHB and CT:
(CT, SALES) + (JHB, SALES) - All JIM’s sales in CT and JACK’s sales in JHB:
(CT, SALES, JIM) + (JHB, SALES, JACK)(Note: This excludes JIM’s sales in JHB and JACK’s sales in CT.)
Types of Tuples:
- Complete tuple: References every dimension.
- Partial tuple: Omits some dimensions. Uses the current member if a dimension is omitted.
MDX tuples have functions like:
- Percentage of parent
- PrevMember
- ParallelPeriod
- Children
After covering MDX, we did a lab where we fixed 10 broken queries. This was refreshing—they provided broken examples, and we had to apply our knowledge (and the help files) to fix them. It was a great way to learn! At first, it was frustrating because MDX is different from SQL, but more labs should be structured like this. I got some right and got stuck on others—I had to peek at the answers to figure out a few.
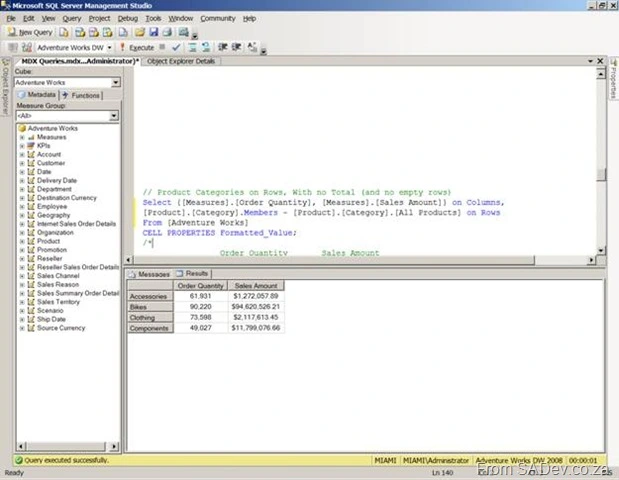
One of the MDX queries I fixed.
By now, it was after 6 PM, so we checked in, headed for dinner, and drinks.