Charting with Lightswitch


One of the key business aspects not included with LightSwitch 2011 is a great set of charting controls, and often I need to have a few for the projects I'm working on. Thankfully, with the Silverlight Toolkit and a touch of code, I can have BRILLIANT charts for no extra cost!
Below are three charts using the Silverlight Toolkit in LightSwitch, which I think look FANTASTIC, and it’s fairly easy to do in four easy-to-follow stages.
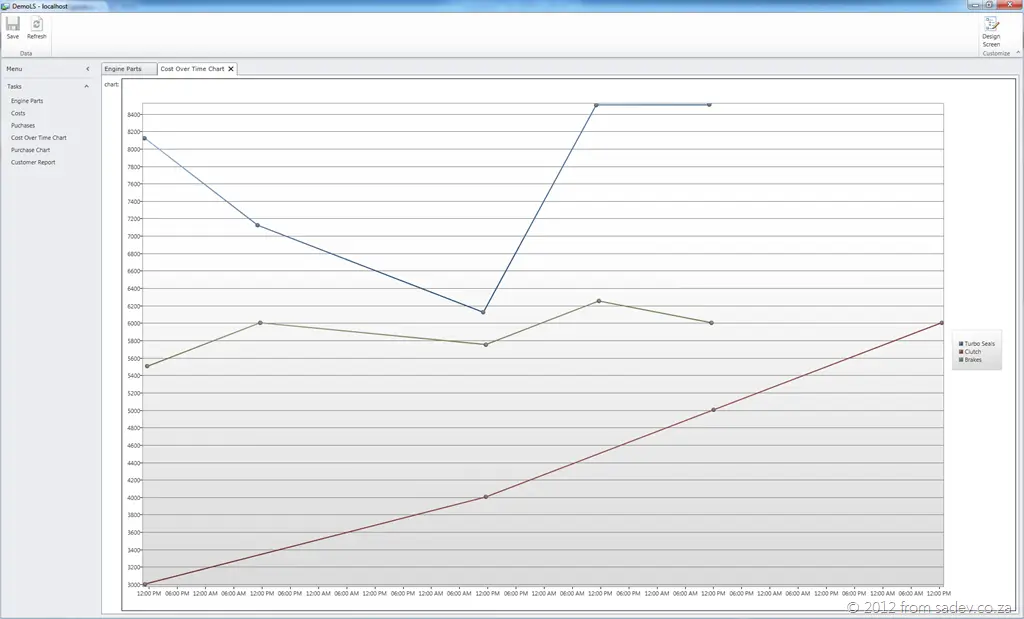
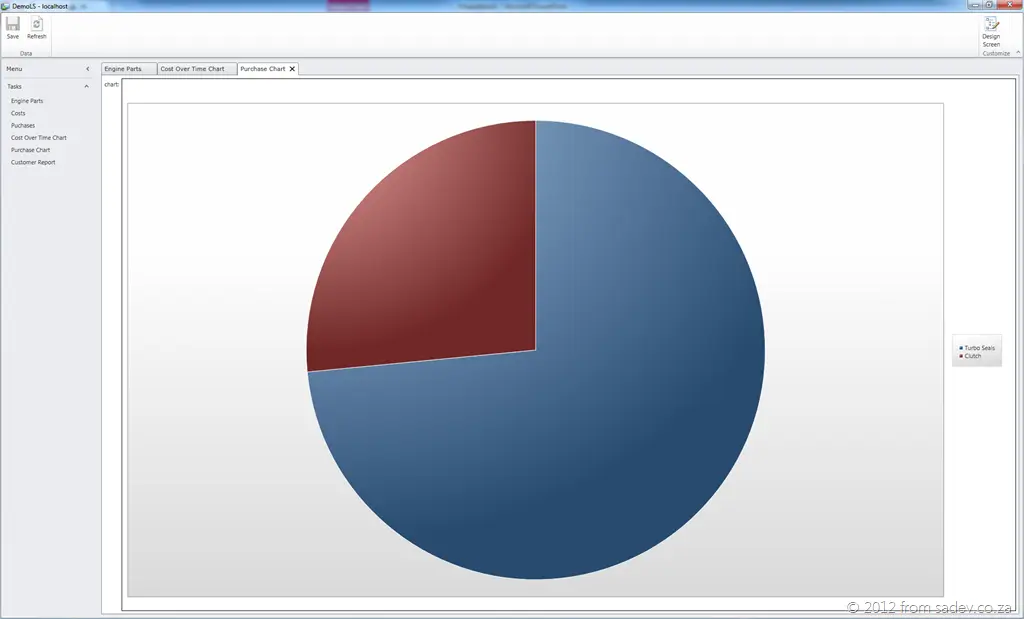
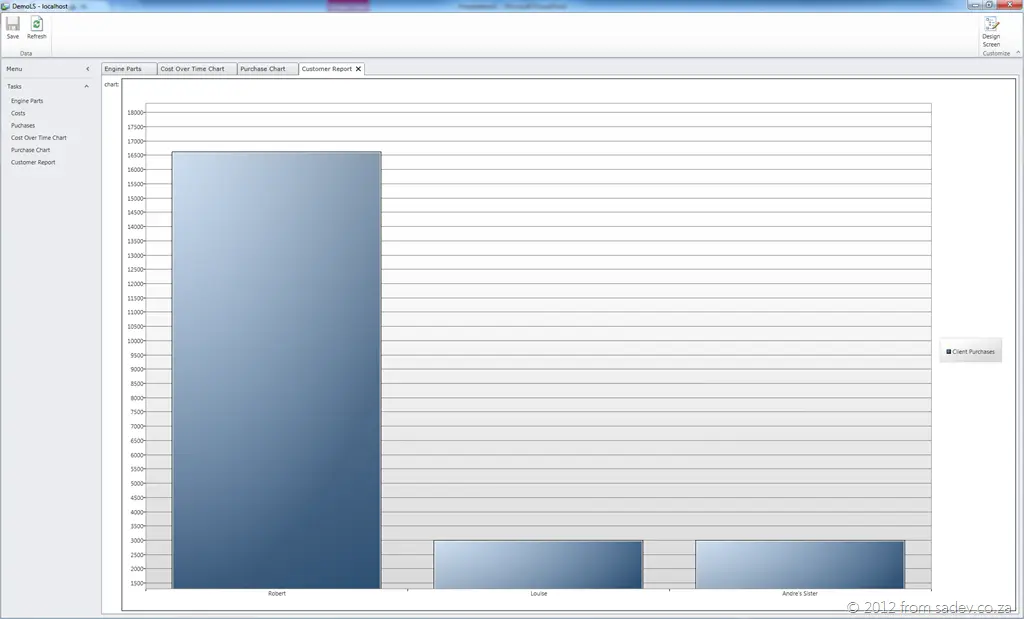
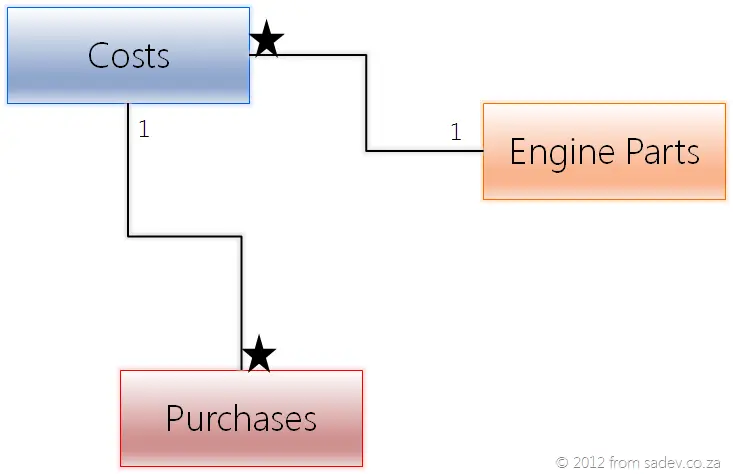
For this tutorial, I have a simple structure of engine parts, costs over time, and purchases, which looks a little like the image below—I’ve already created the data structure and UI for adding those in LightSwitch.
Stage 1: Get the toolkit
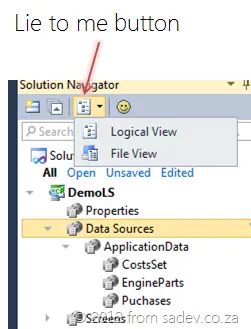
To start, we need to switch out of the Logical View and into the Files View. To do this in Solution Explorer, click the View drop-down (that’s what I call it) and change the view.
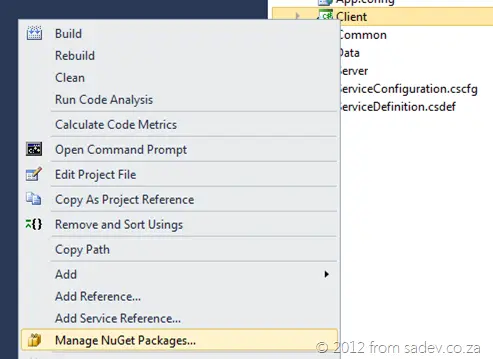
Next, right-click on the client project and select Manage NuGet Packages. If you don’t have NuGet yet, stop, download it from www.nuget.org, install it, and then come back.
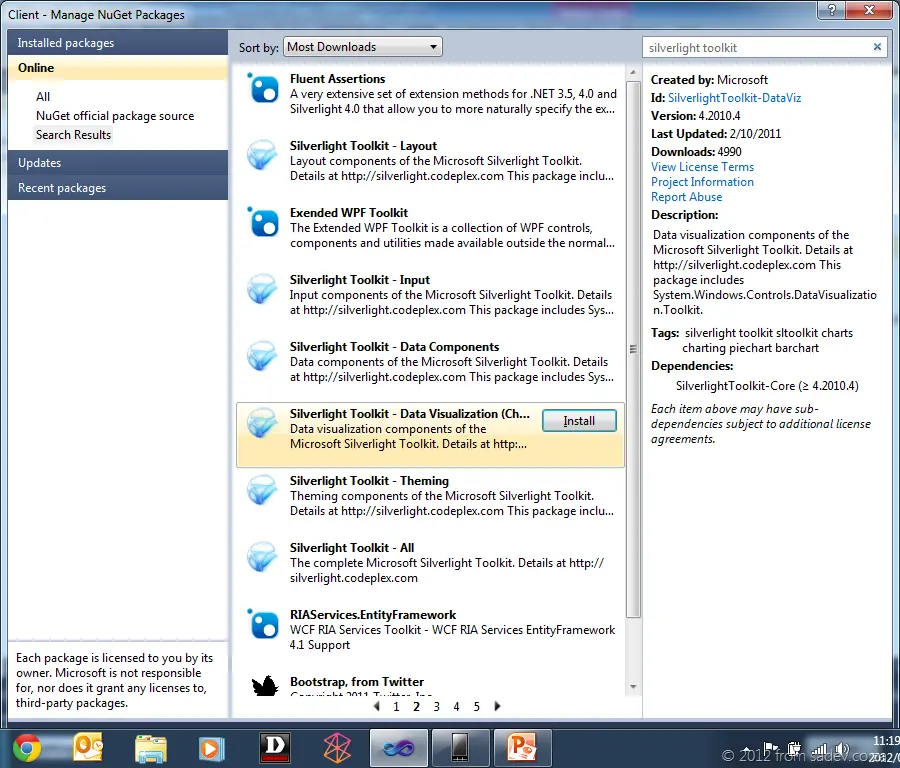
In NuGet, search for the Silverlight Toolkit and install the Data Visualization package. Now, unfortunately, LightSwitch isn’t great with NuGet, so we’re using this to get the packages, but they won’t be properly installed as you might expect.
Stage 2: Create the screen and add the control
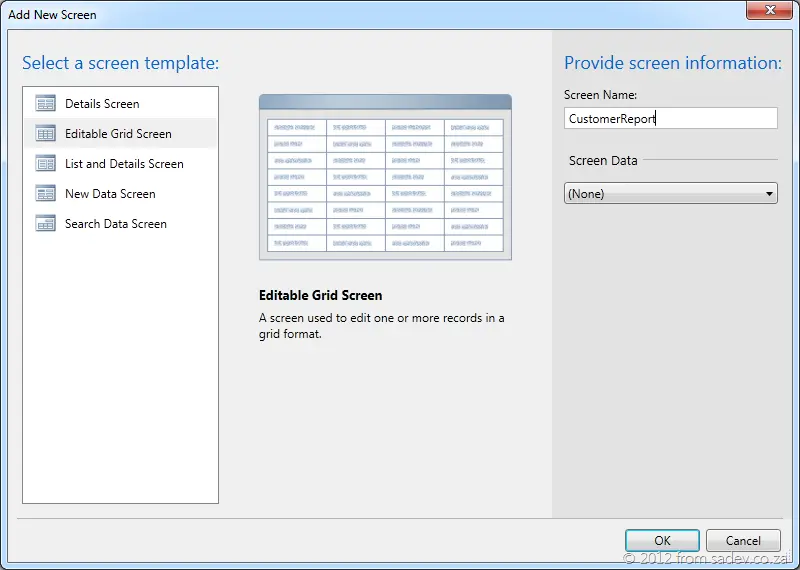
Now switch back to the Logical View and add a new Editable Grid Screen. Give it a nice name but do not select any Screen Data.
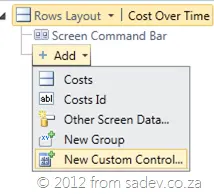
In your new screen, click the Add button at the bottom and select New Custom Control. If you don’t have that option, you’ve selected the Add option for the Screen Command Bar, so make sure the Rows Layout is selected at the top.
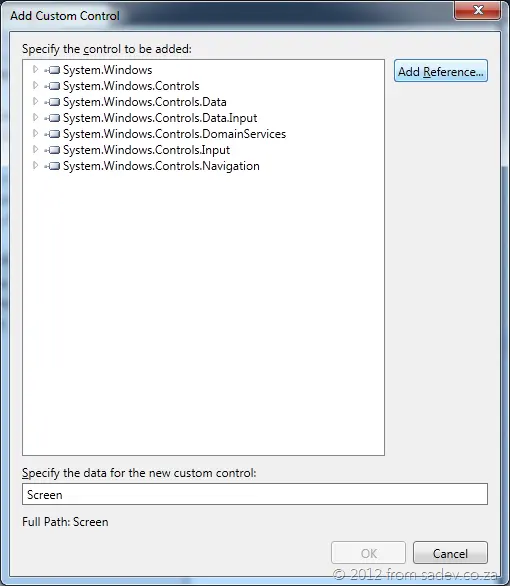
Now we need to add the assemblies for the Silverlight Toolkit packages. To do this, press the Add Reference button in the Add Custom Control screen.
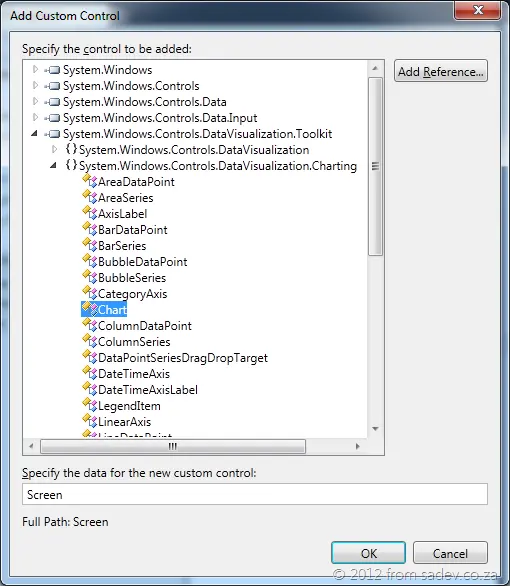
Browse to the packages folder in the root of the LightSwitch project and add the two assemblies. Once done, browse the System.Windows.Controls.DataVisualization.Toolkit assembly and go to System.Windows.Controls.DataVisualization.Charting.Chart, then select OK.
Stage 3: Configure the chart control in LightSwitch
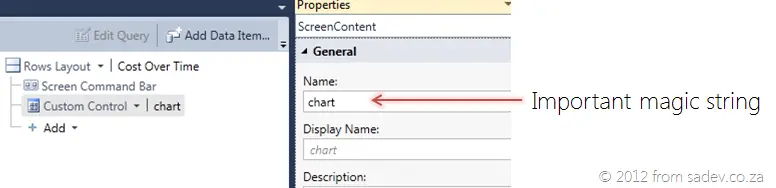
The control should now be listed. Next, go to its properties and give the chart a name—this is important, so name it something memorable.
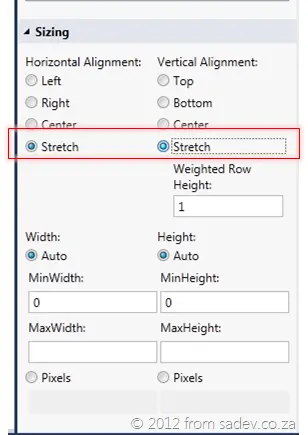
Now, change the sizing of the chart control to be Stretch for both Horizontal and Vertical Alignment. This allows the chart to use all the space on the screen!
Stage 4: Add some code to get the data and put it in the chart
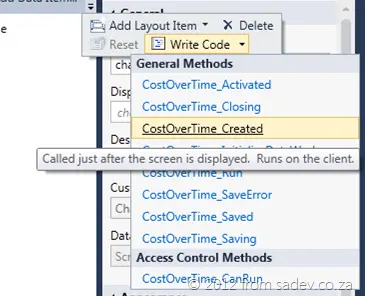
Now we need to add the code to get the data and render the chart. We’ll do this in the Created event for the screen (to get there, click the Write Code button in the toolbar and select the event).
Here’s the code we add to the event:
- Find the chart control.
- Get the data from the DataWorkspace into a list.
- Set the chart to use the data.
partial void CostOverTimeChart_Created()
{
    // Write your code here.
    var chart = this.FindControl("chart");
    chart.ControlAvailable += (s, e) =>
    {
        this.Details.Dispatcher.BeginInvoke(() =>
        {
            var dataPoints = (from Costs c in this.DataWorkspace.ApplicationData.CostsSet
                             group c by c.EnginePart).ToList();

            var chartControl = e.Control as Chart;
            chartControl.Dispatcher.BeginInvoke(() =>
            {
                chartControl.Series.Clear();
                foreach (var group in dataPoints)
                {
                    chartControl.Series.Add(new LineSeries()
                    {
                        Title = group.Key,
                        IndependentValuePath = "PointInTime",
                        DependentValuePath = "Cost",
                        ItemsSource = group
                    });
                }
            });
        });
    };
}
If we dive into the code:
- Line 4: We use the
FindControlmethod with the magic string we named the chart to find the control wrapping it. - Line 5: We attach to the event for when the chart is available.
- Line 7: We use the dispatcher for the screen to run a call to the DataWorkspace to get the data and put it into a list. We need to dispatch this because the DataWorkspace is on a separate thread.
- Line 12: We get the actual chart control from the event arguments.
- Line 13: To set the values on the control, we use the chart’s dispatcher because it is also separately threaded.
- Line 15: We clear any existing series and add new ones. This code is nothing special to LightSwitch—just standard Silverlight charting.
Wrap-up
It seems like a lot of work, and it is! You could make this easier by wrapping it in a custom LightSwitch control, which would give you great reuse, but that’s a lot of work too. In the long run, if you use many charts, you’ll save time by building the custom control—but if you only need one or two, this is quicker and less of a learning curve.
Below, you’ll find a link to the sample project I used to create all these charts—it includes all the code too. Make sure you have NuGet installed before you use it!